Mobile App
Company:
Los Angeles County Office of Education
The Los Angeles County Office of Education (LACOE) is the largest regional education agency in the United States, serving the public education needs of Los Angeles County. LACOE provides educational programs and support services to 80 school districts and over 1.4 million students across the county, including specialized programs for at-risk students, professional development for educators, and fiscal oversight for district operations. Its mission is to support districts in enhancing educational quality, equity, and student success across the region.
Problem
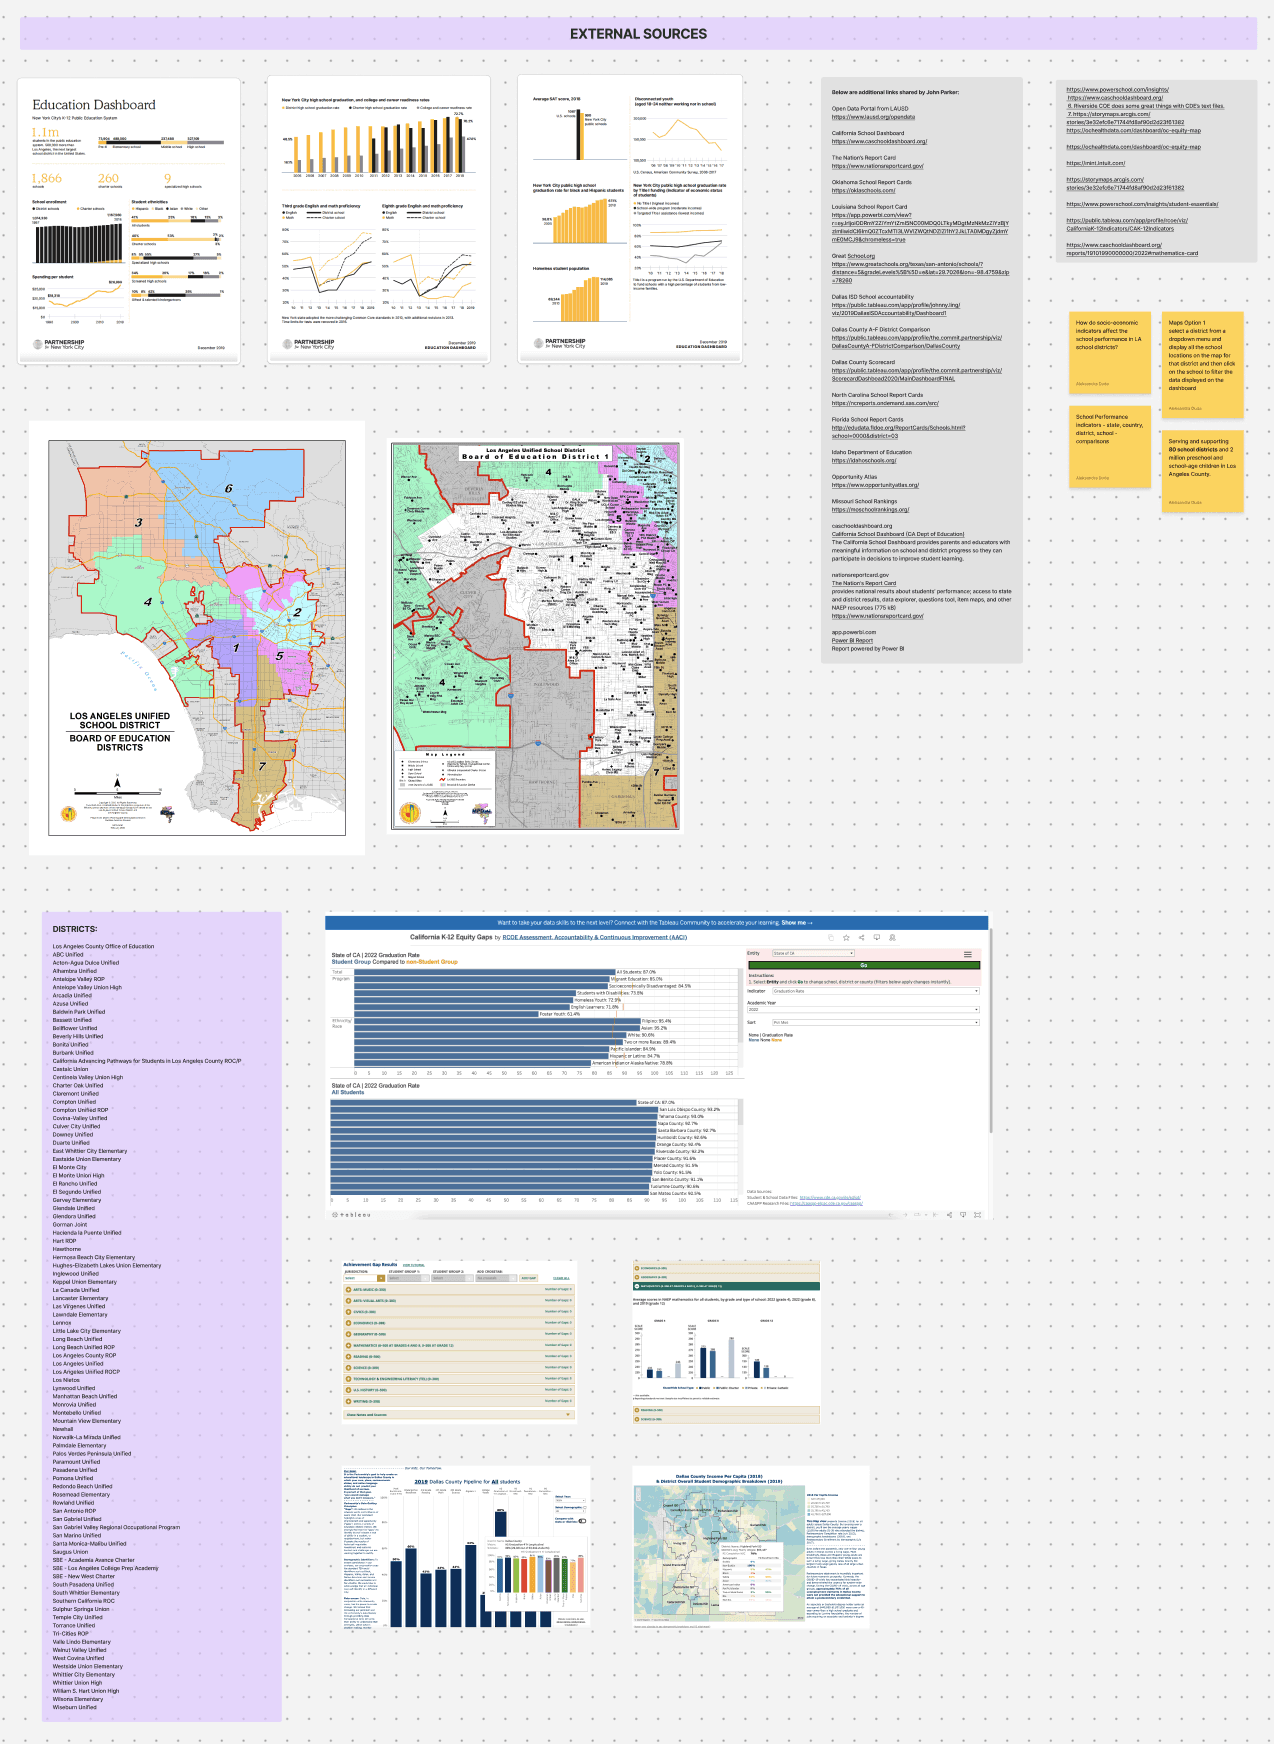
The United States offers extensive data on schools, communities, demographics, economics, and funding distribution, but this information is often dispersed across multiple sources, making it difficult to access in one place.
Solution
LACOE aims to consolidate and visualize this data on an interactive map, allowing parents to make informed decisions when selecting schools. Additionally, by making this tool public, researchers can better understand how community and economic factors influence educational outcomes, fostering greater insight and transparency.
Interactive Map Search
User Friendly School Data
Deep School Analysis
Historical Information and Ai Predictions
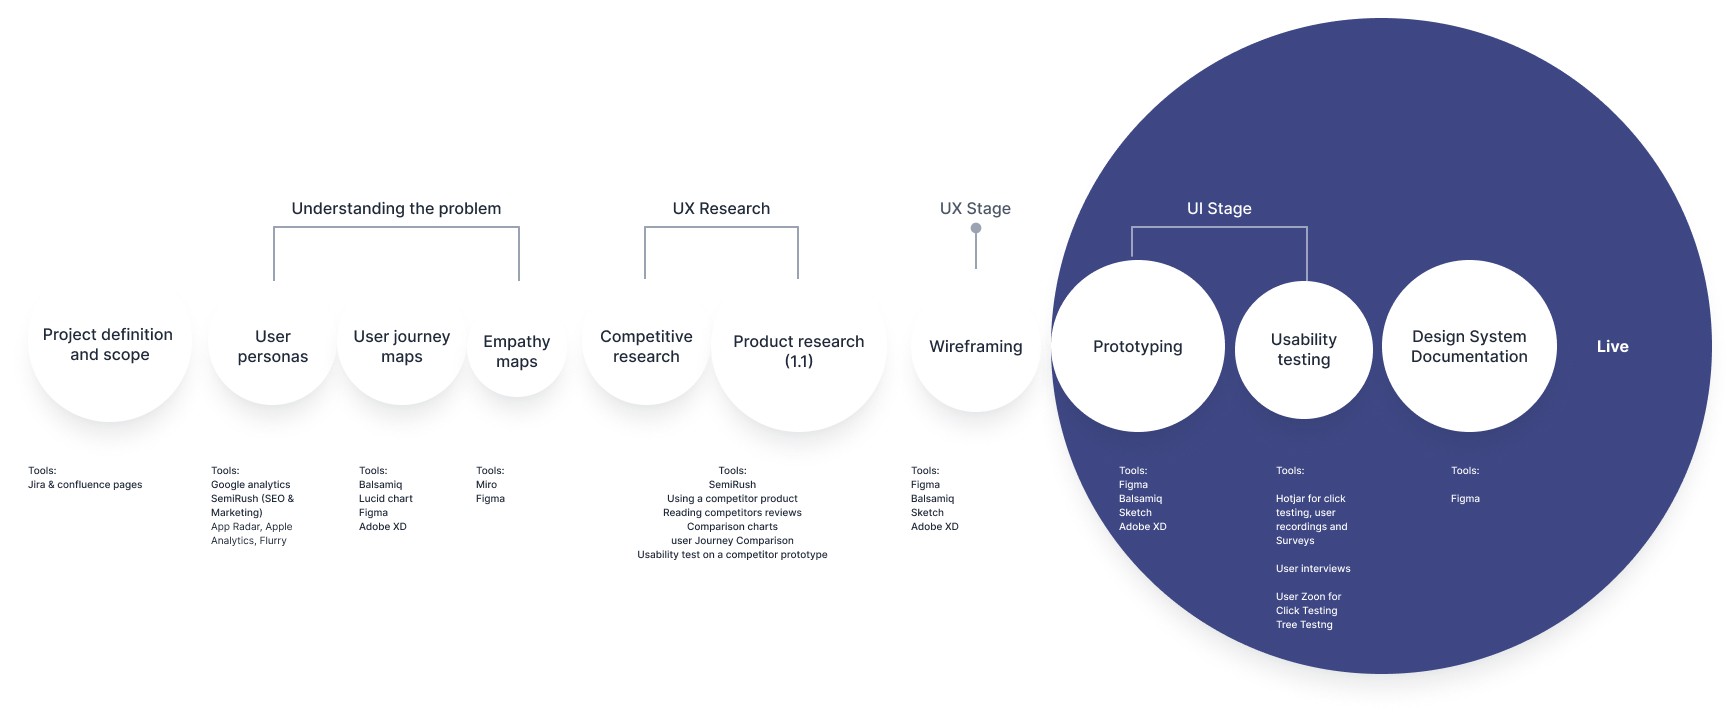
Design Development Process
10 months, 150+ interview sessions and workshops
UX Research
Findings:
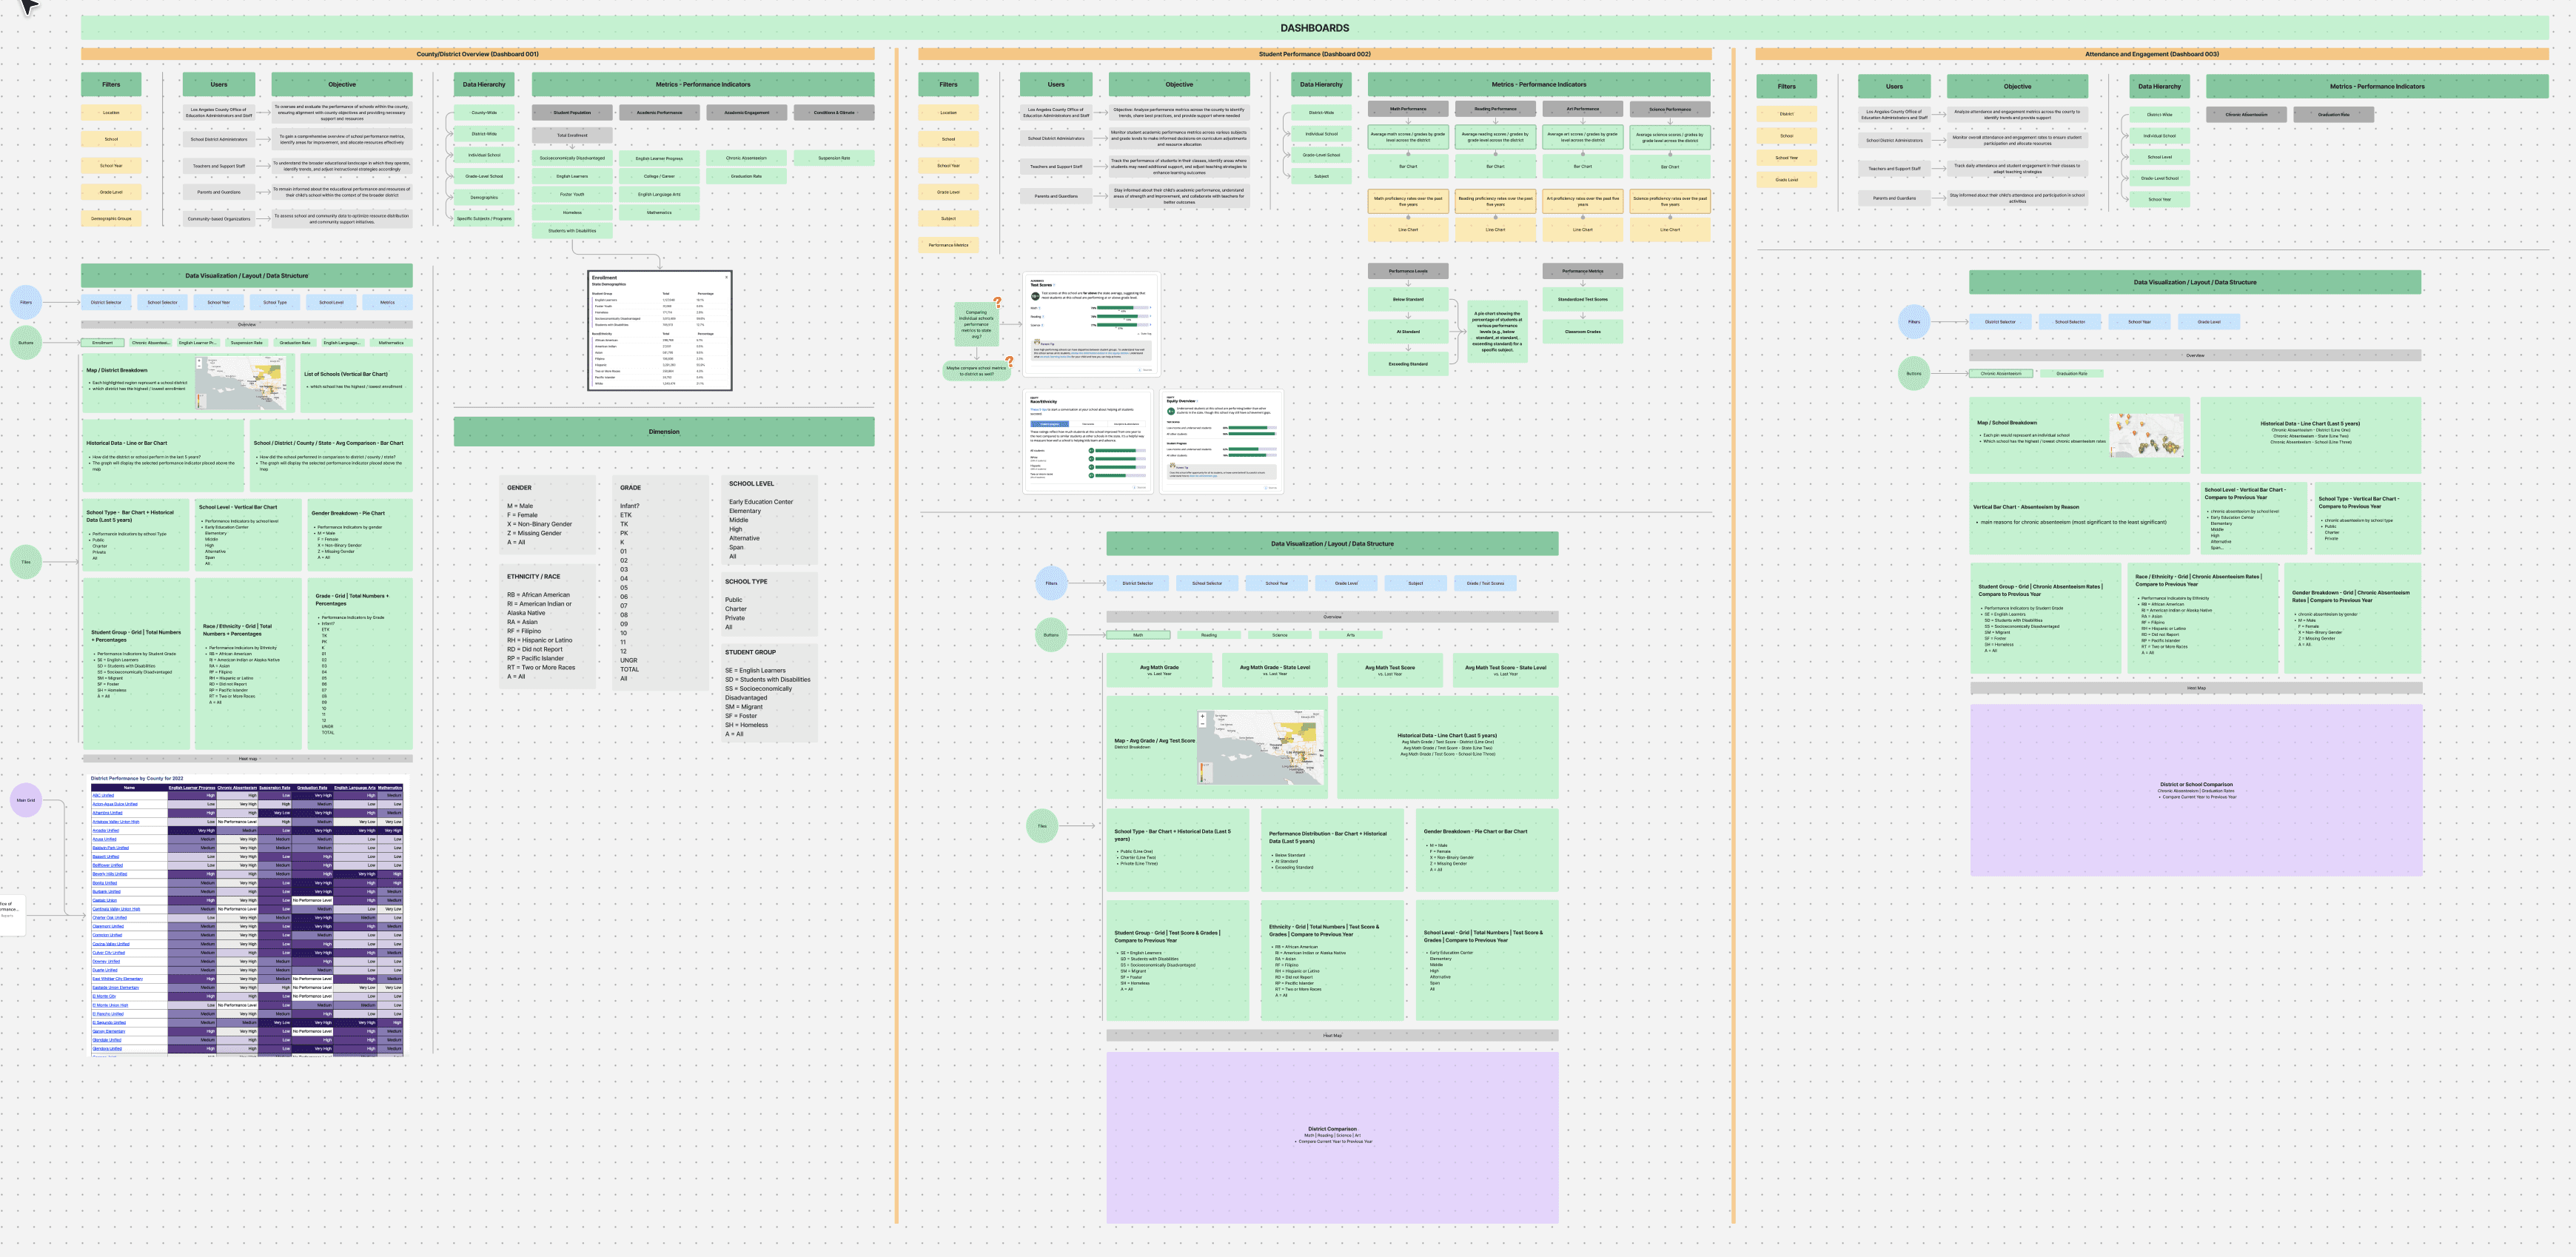
Data from multiple sources is less clean and organized than expected, which affects the UX structure and layout.
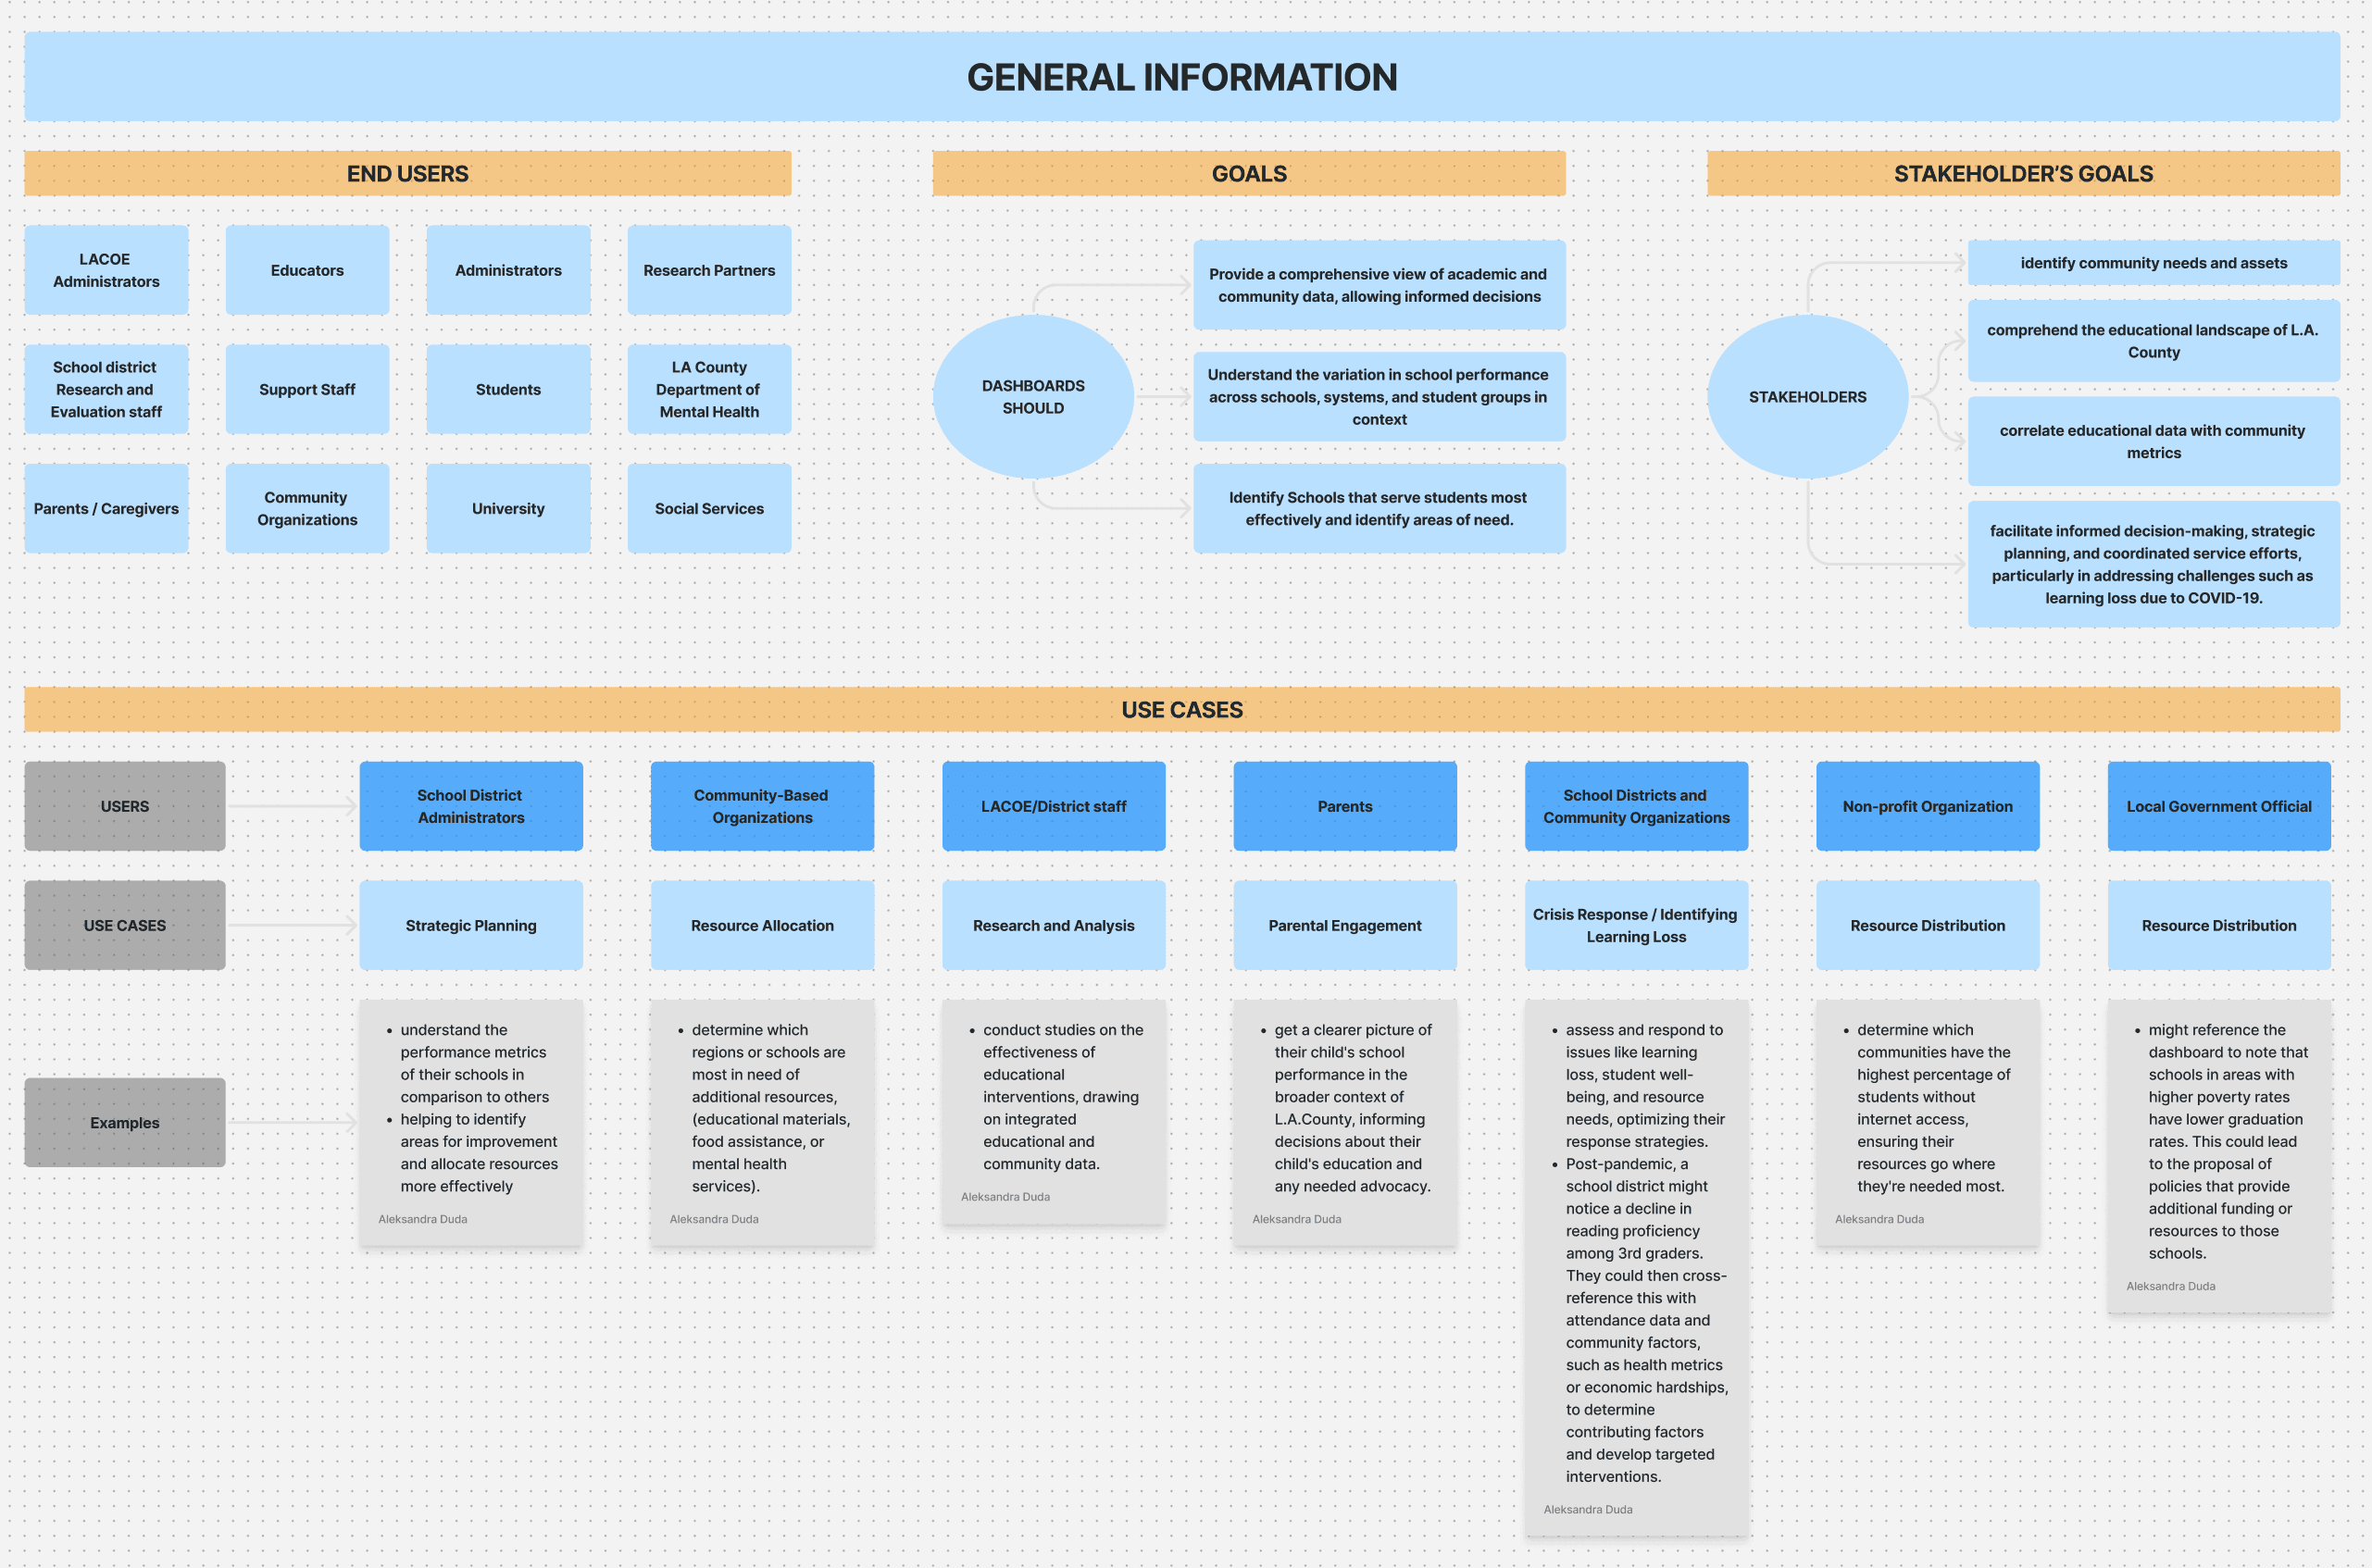
The dashboard will serve multiple user personas with varying goals, with parents looking for the best school for their child as the primary audience.
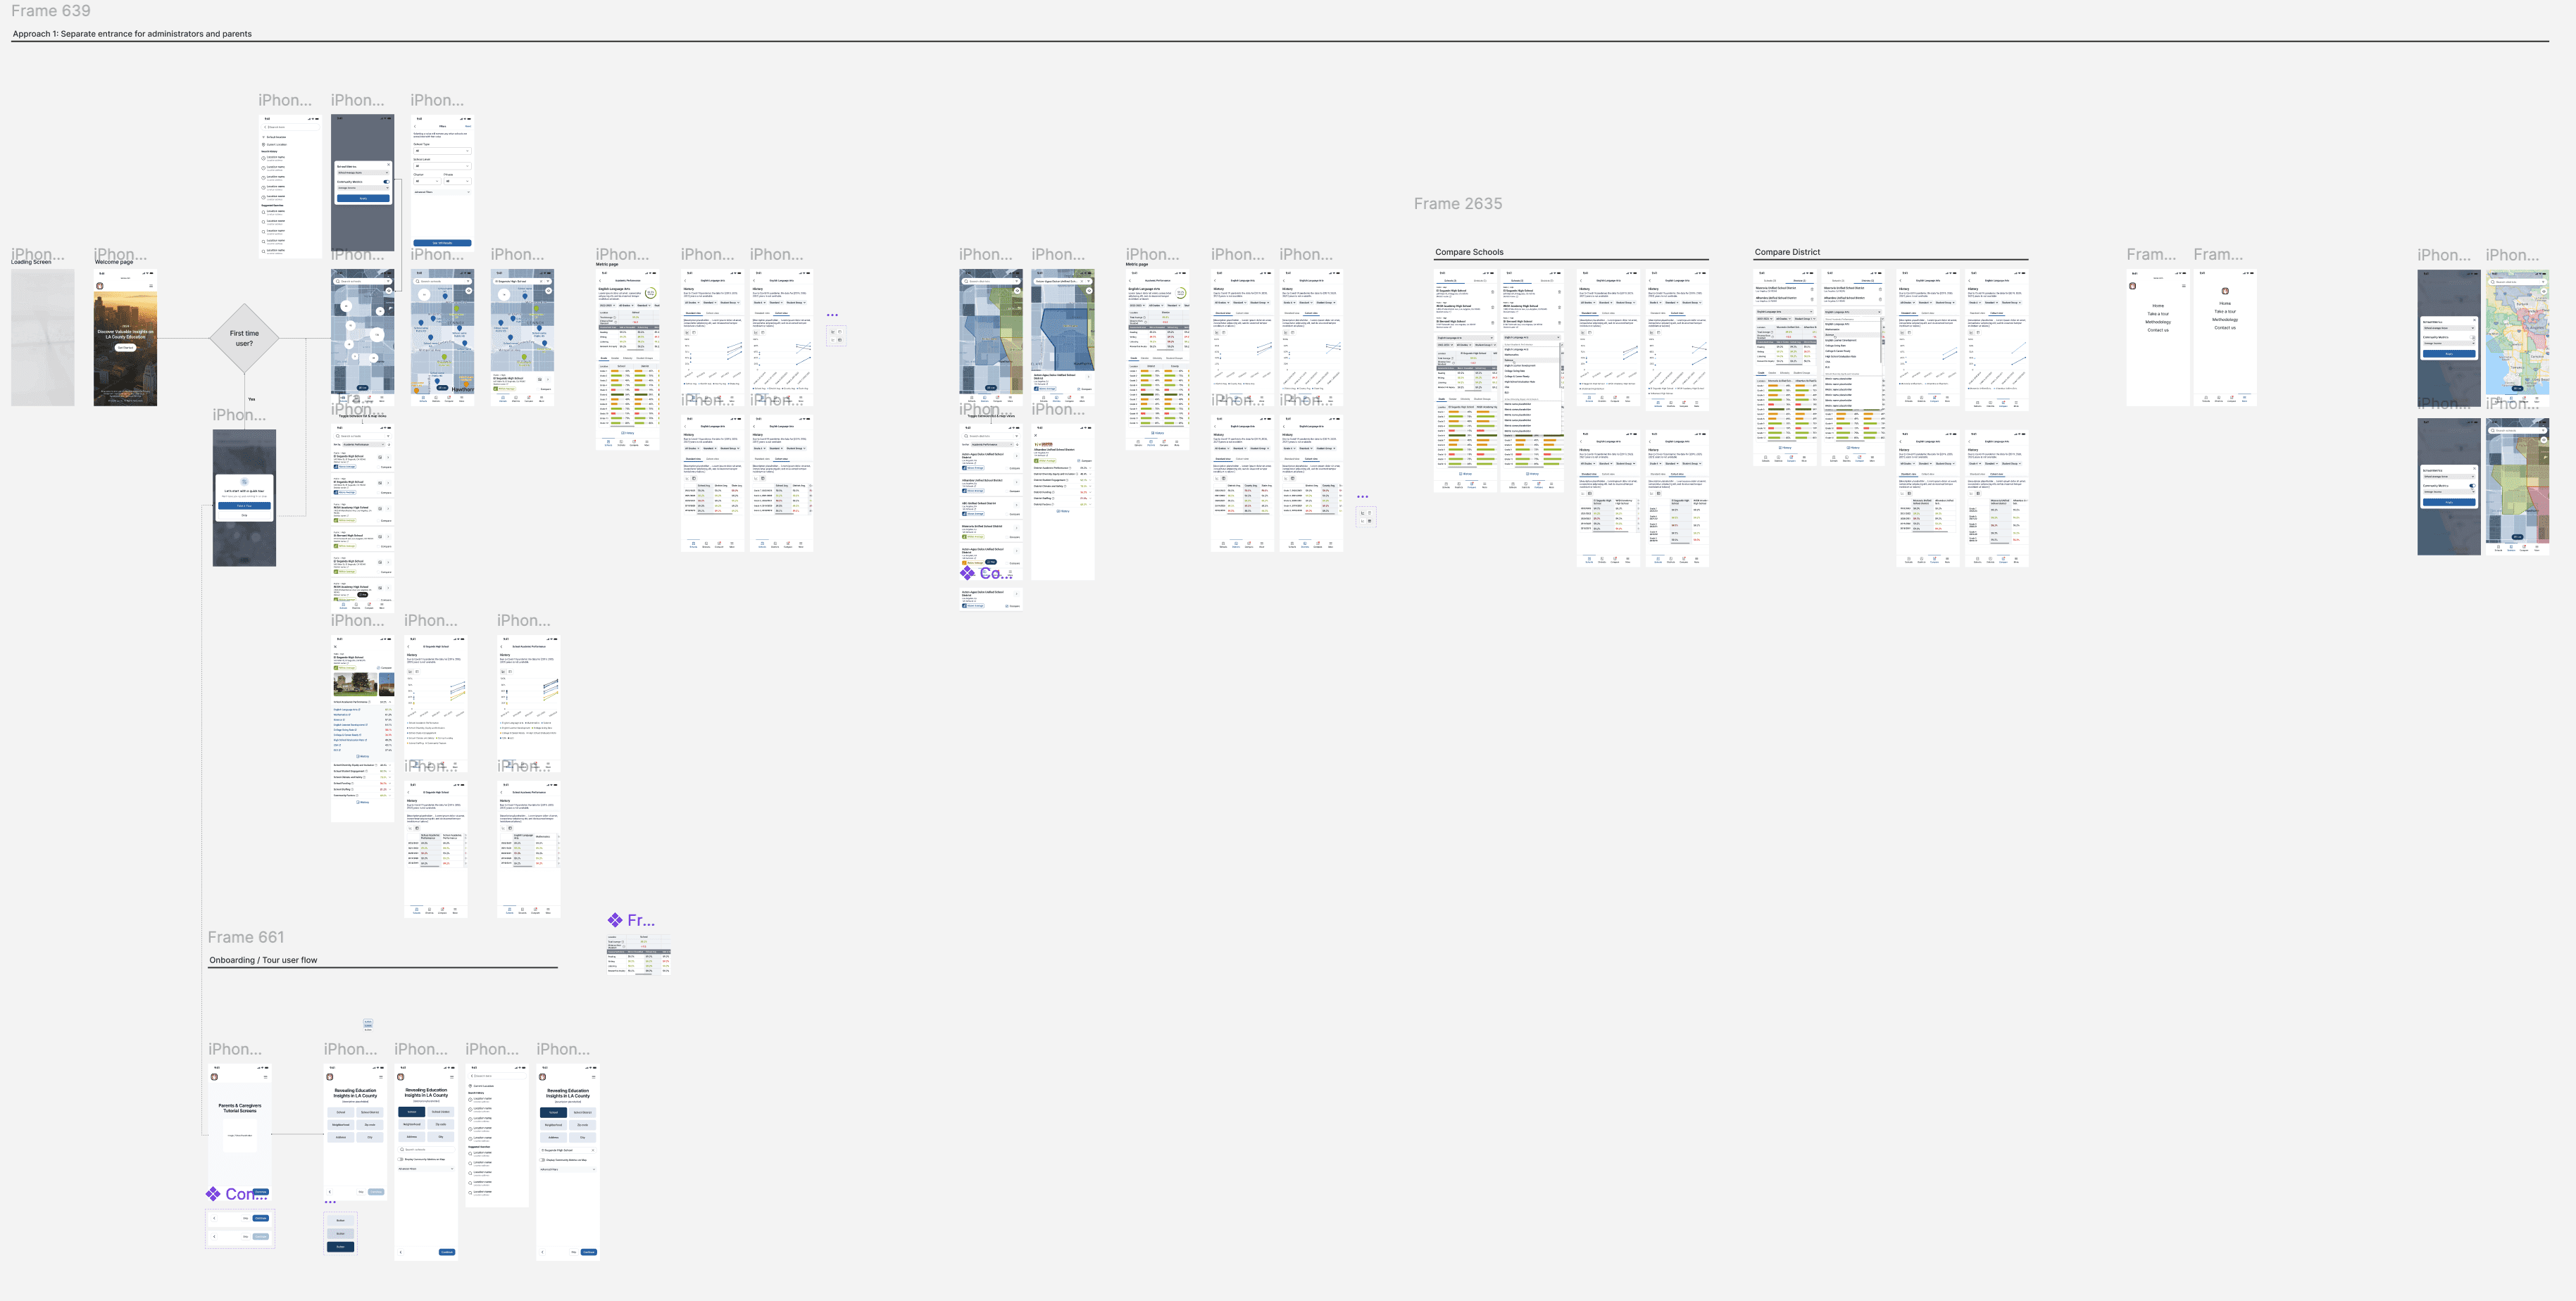
High-fidelity wireframes
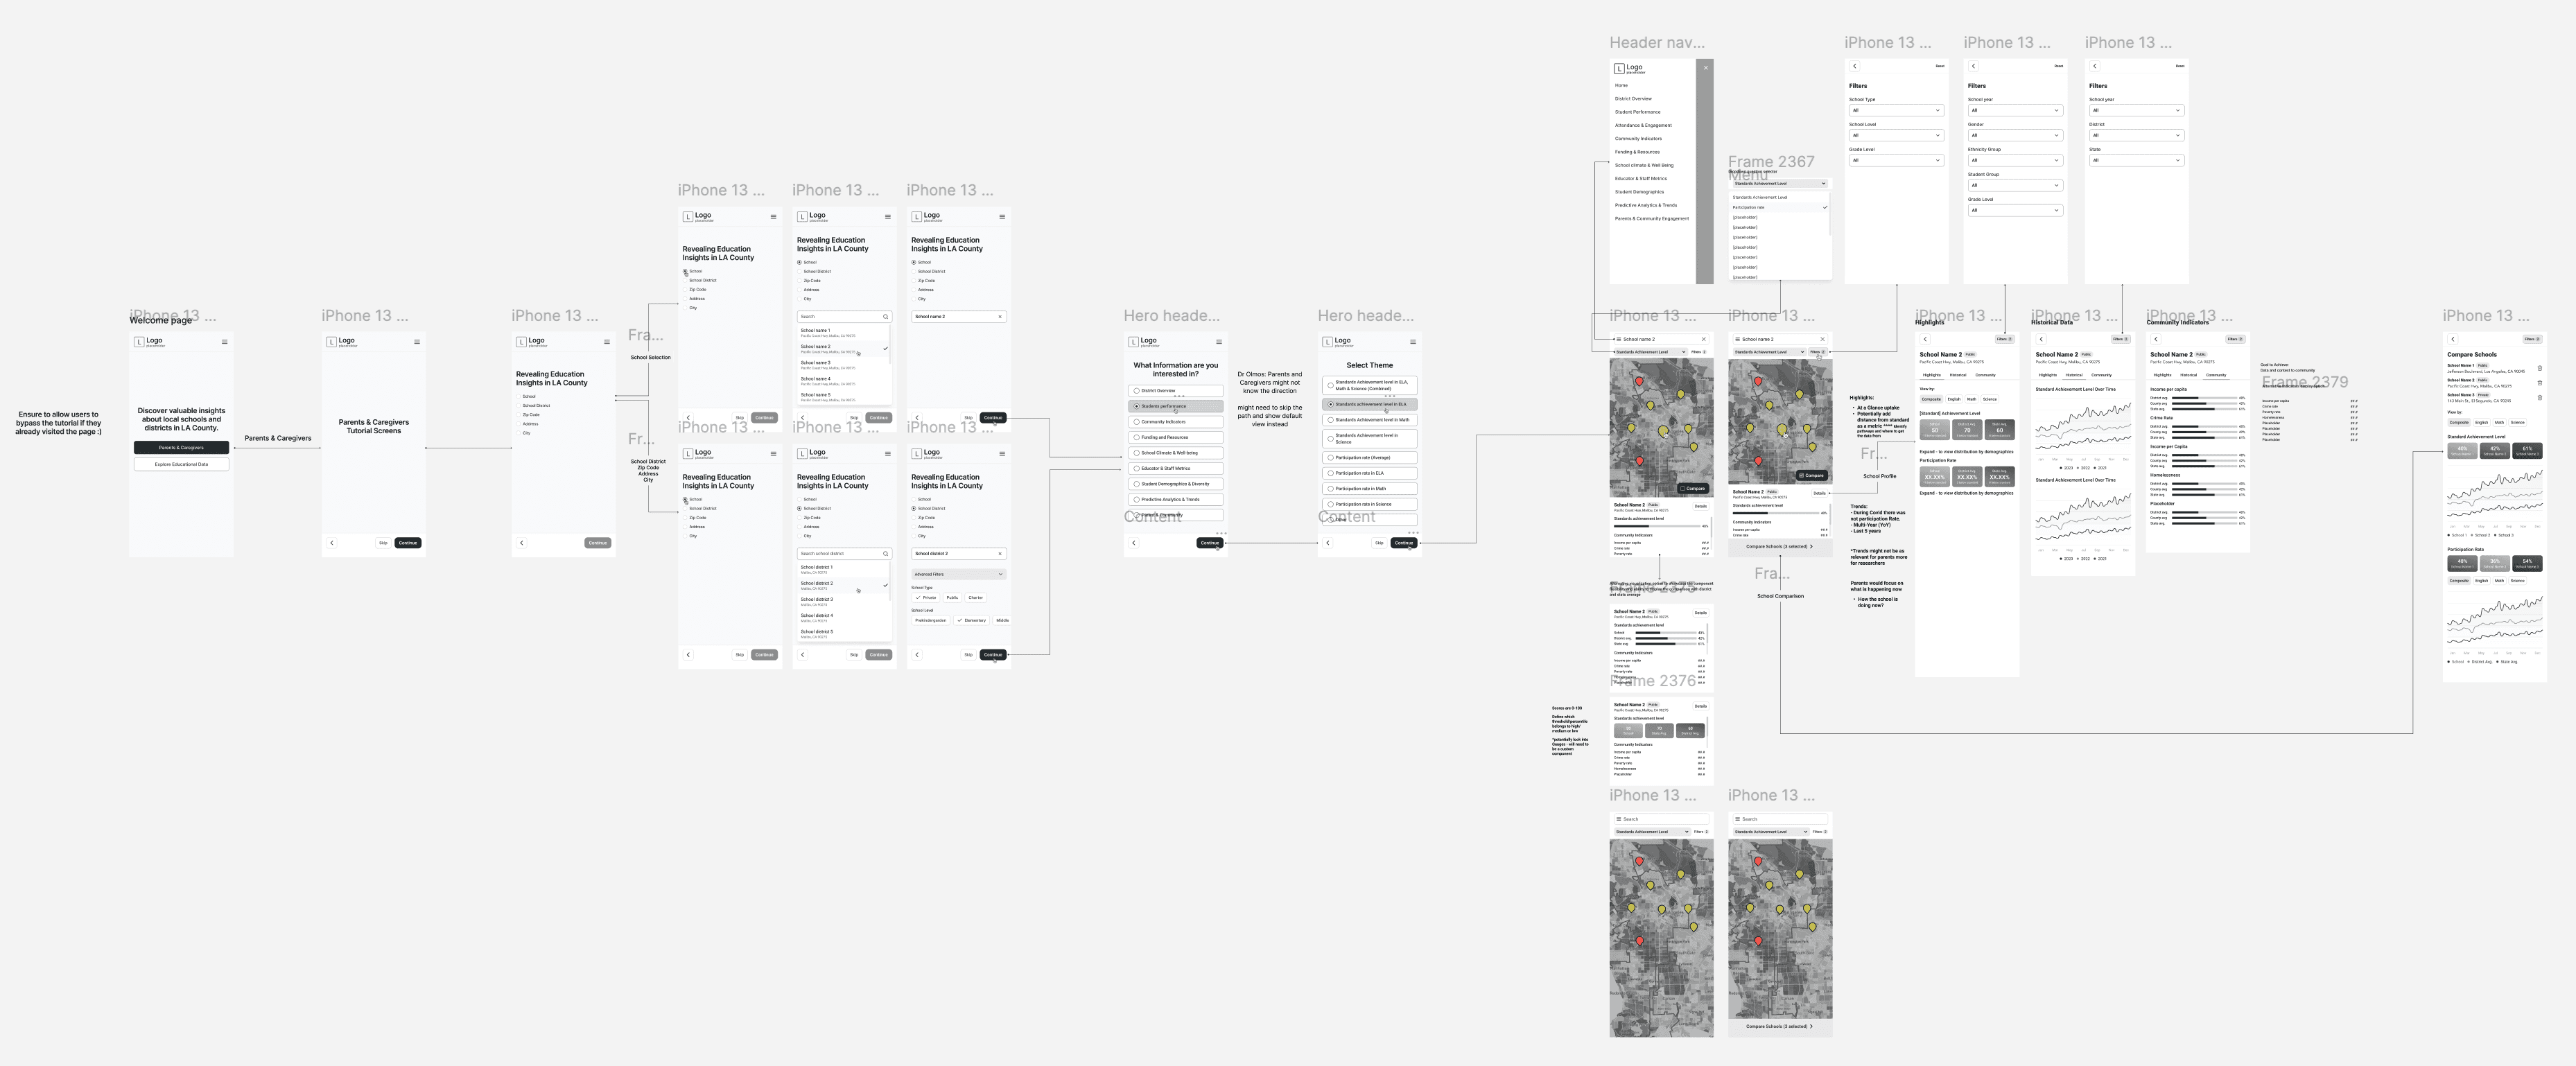
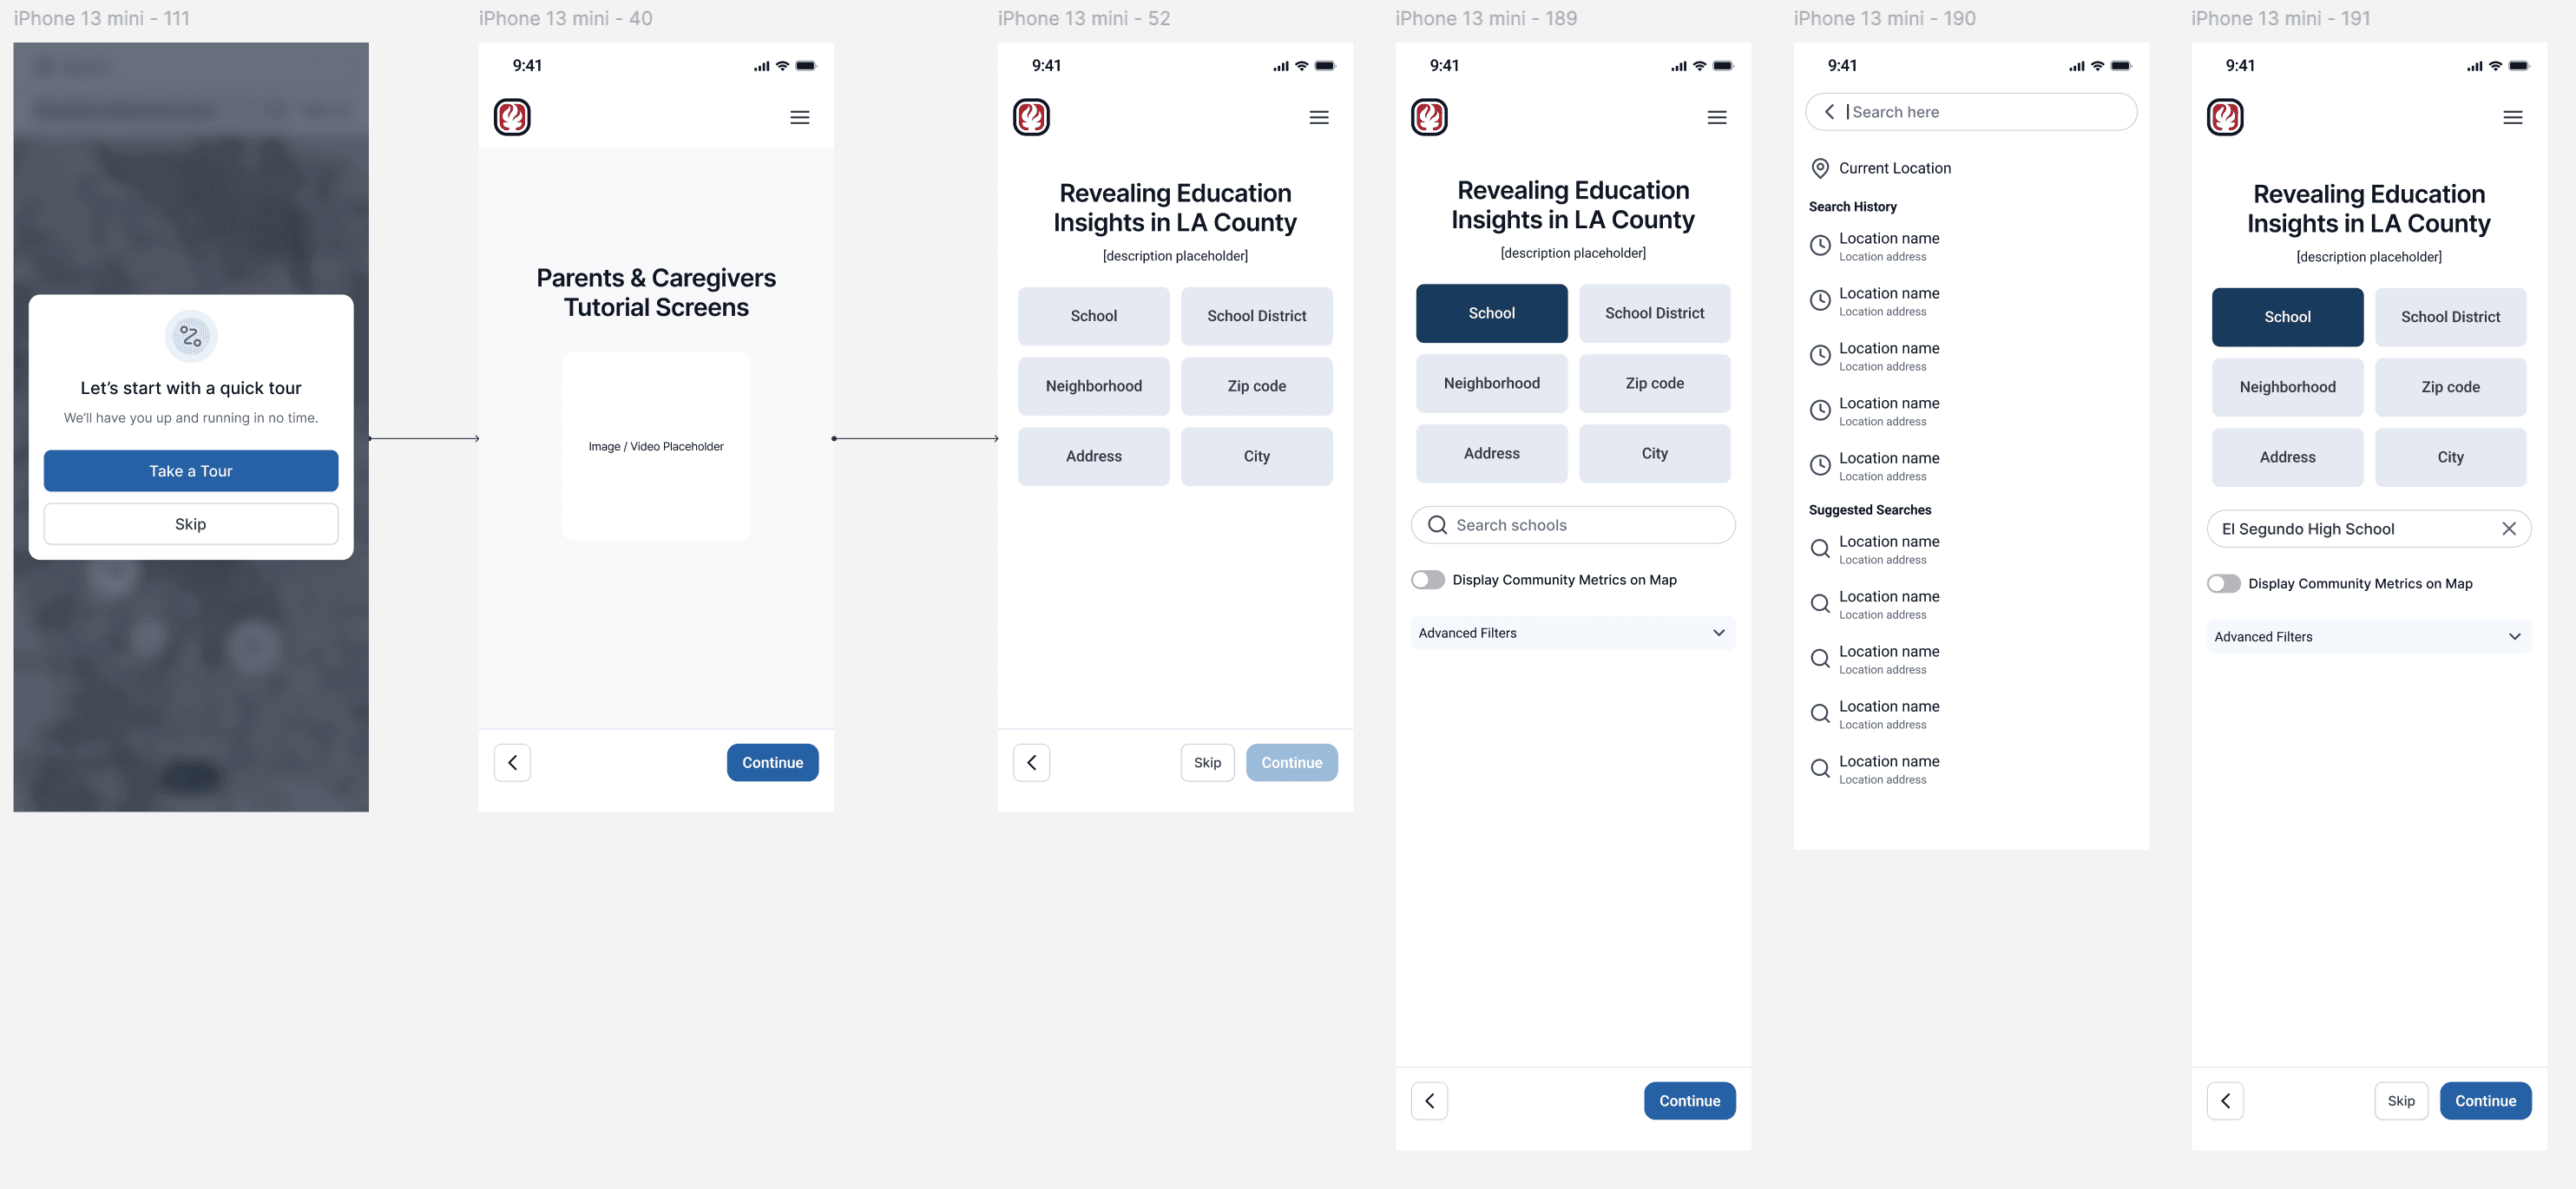
The application begins with onboarding to customize features based on user preferences and goals.
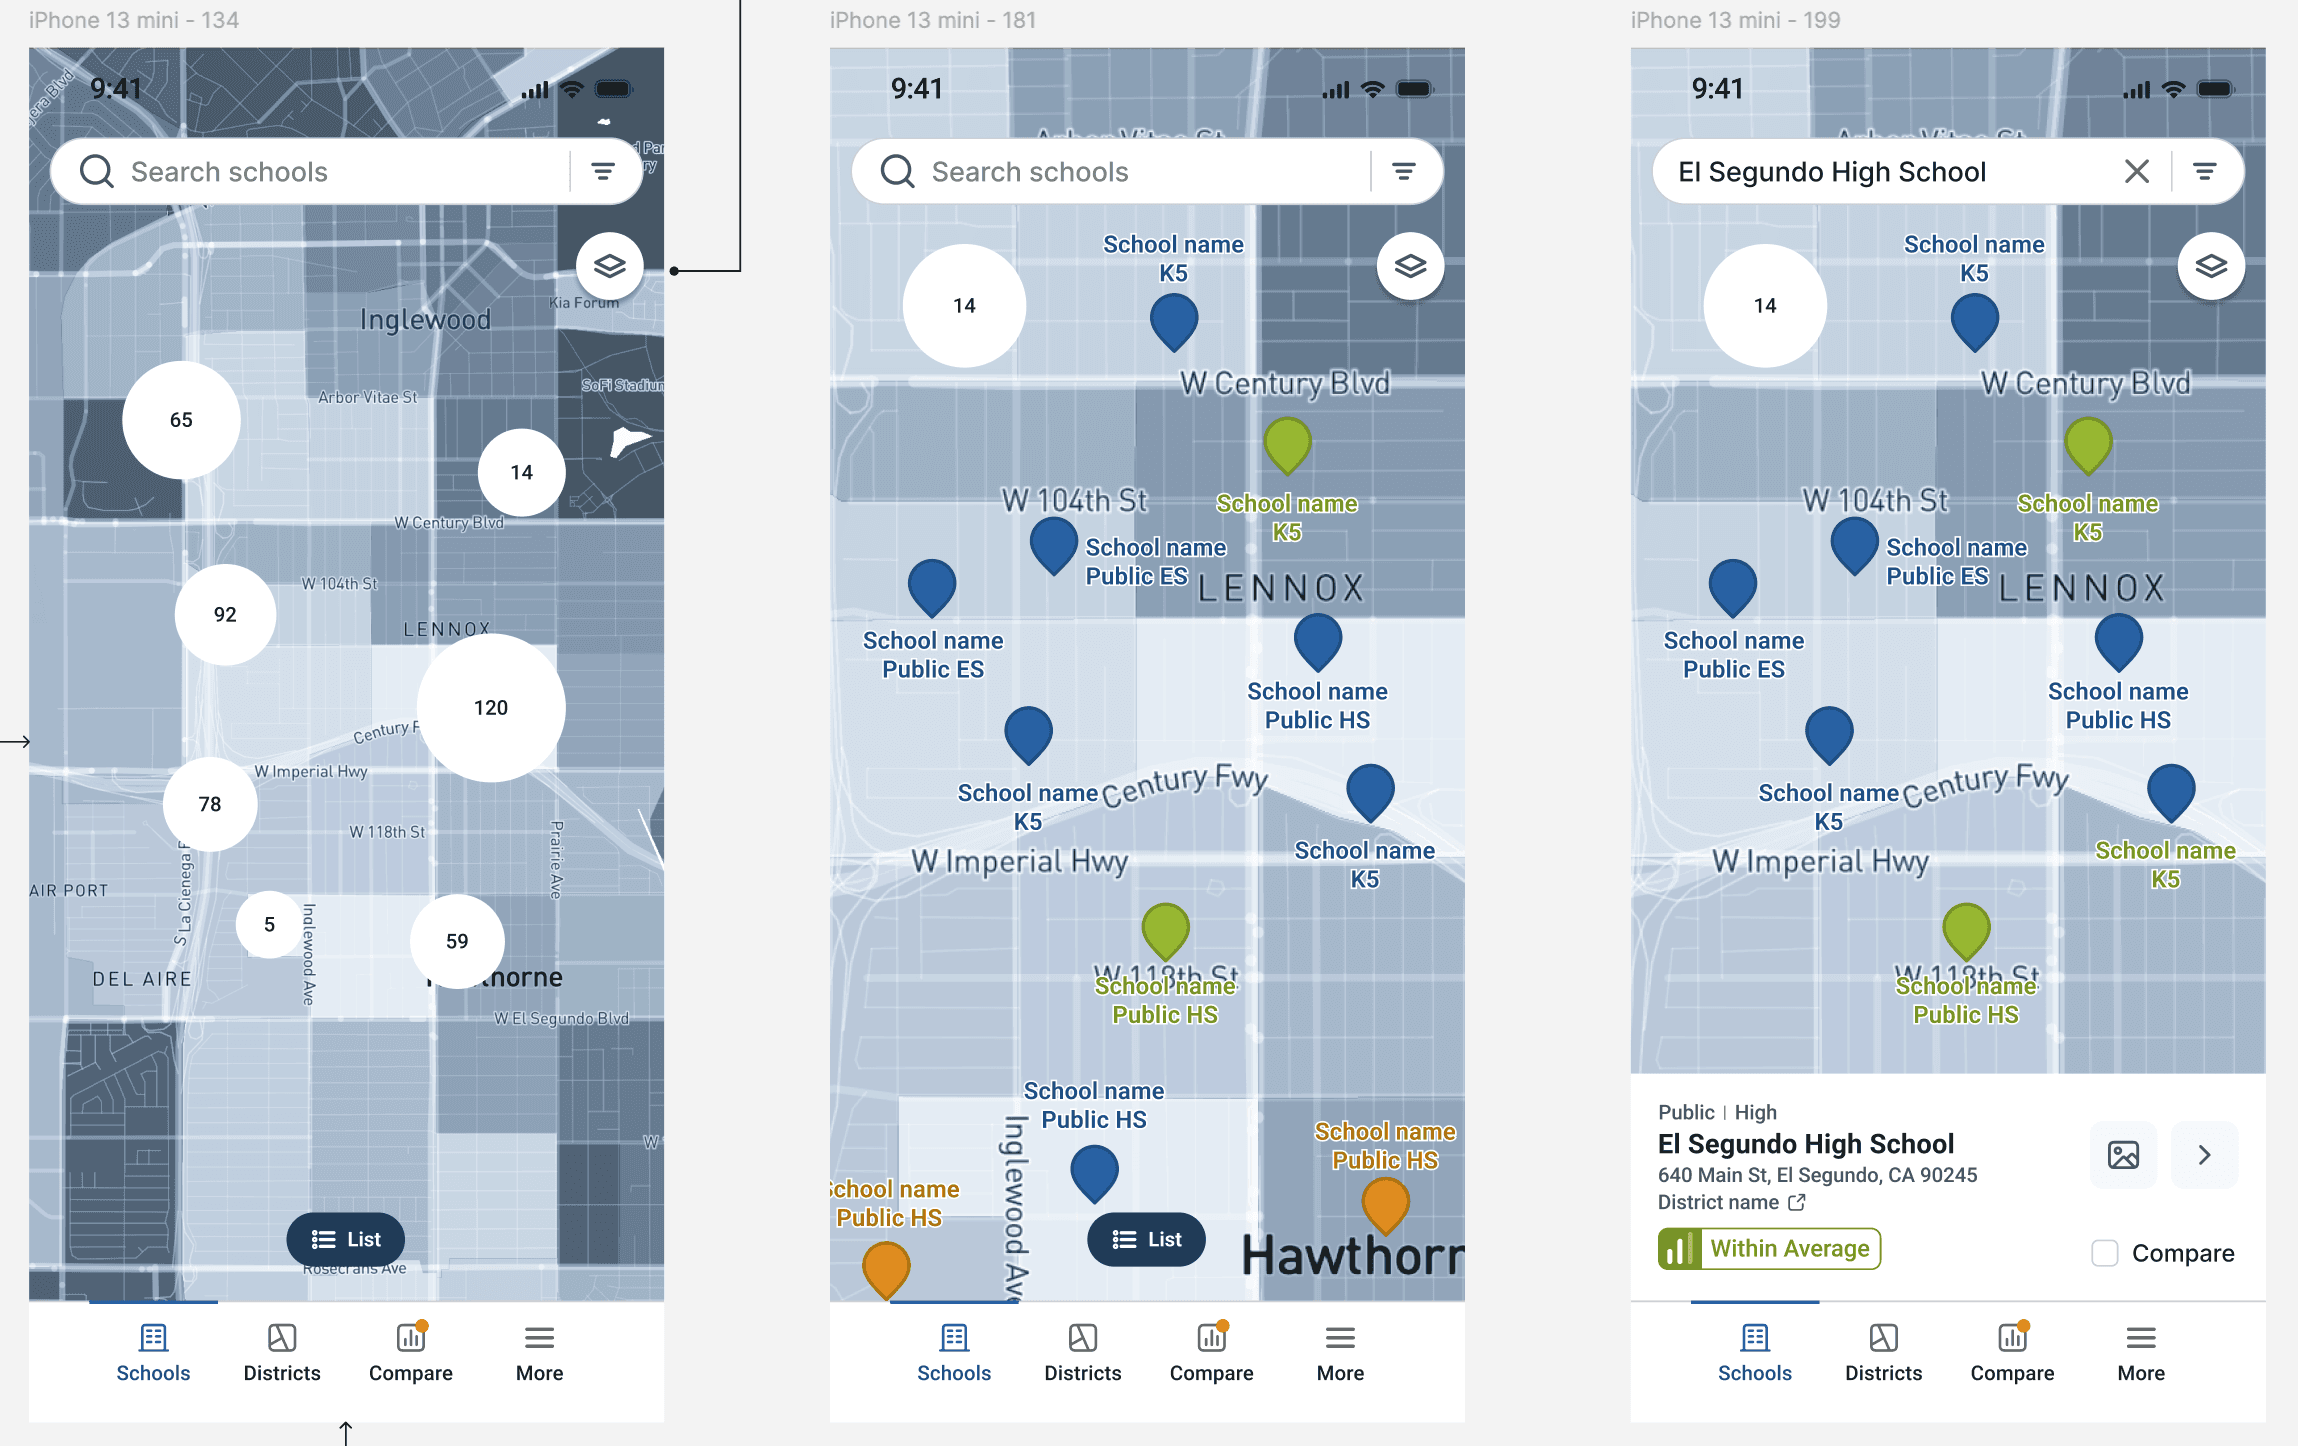
Once onboarding is complete, the app displays an interactive heatmap of nearby schools.
An intuitive heatmap displays demographic data and school performance, with points indicating overall school ratings: blue for low, orange for average, and green for excellent.
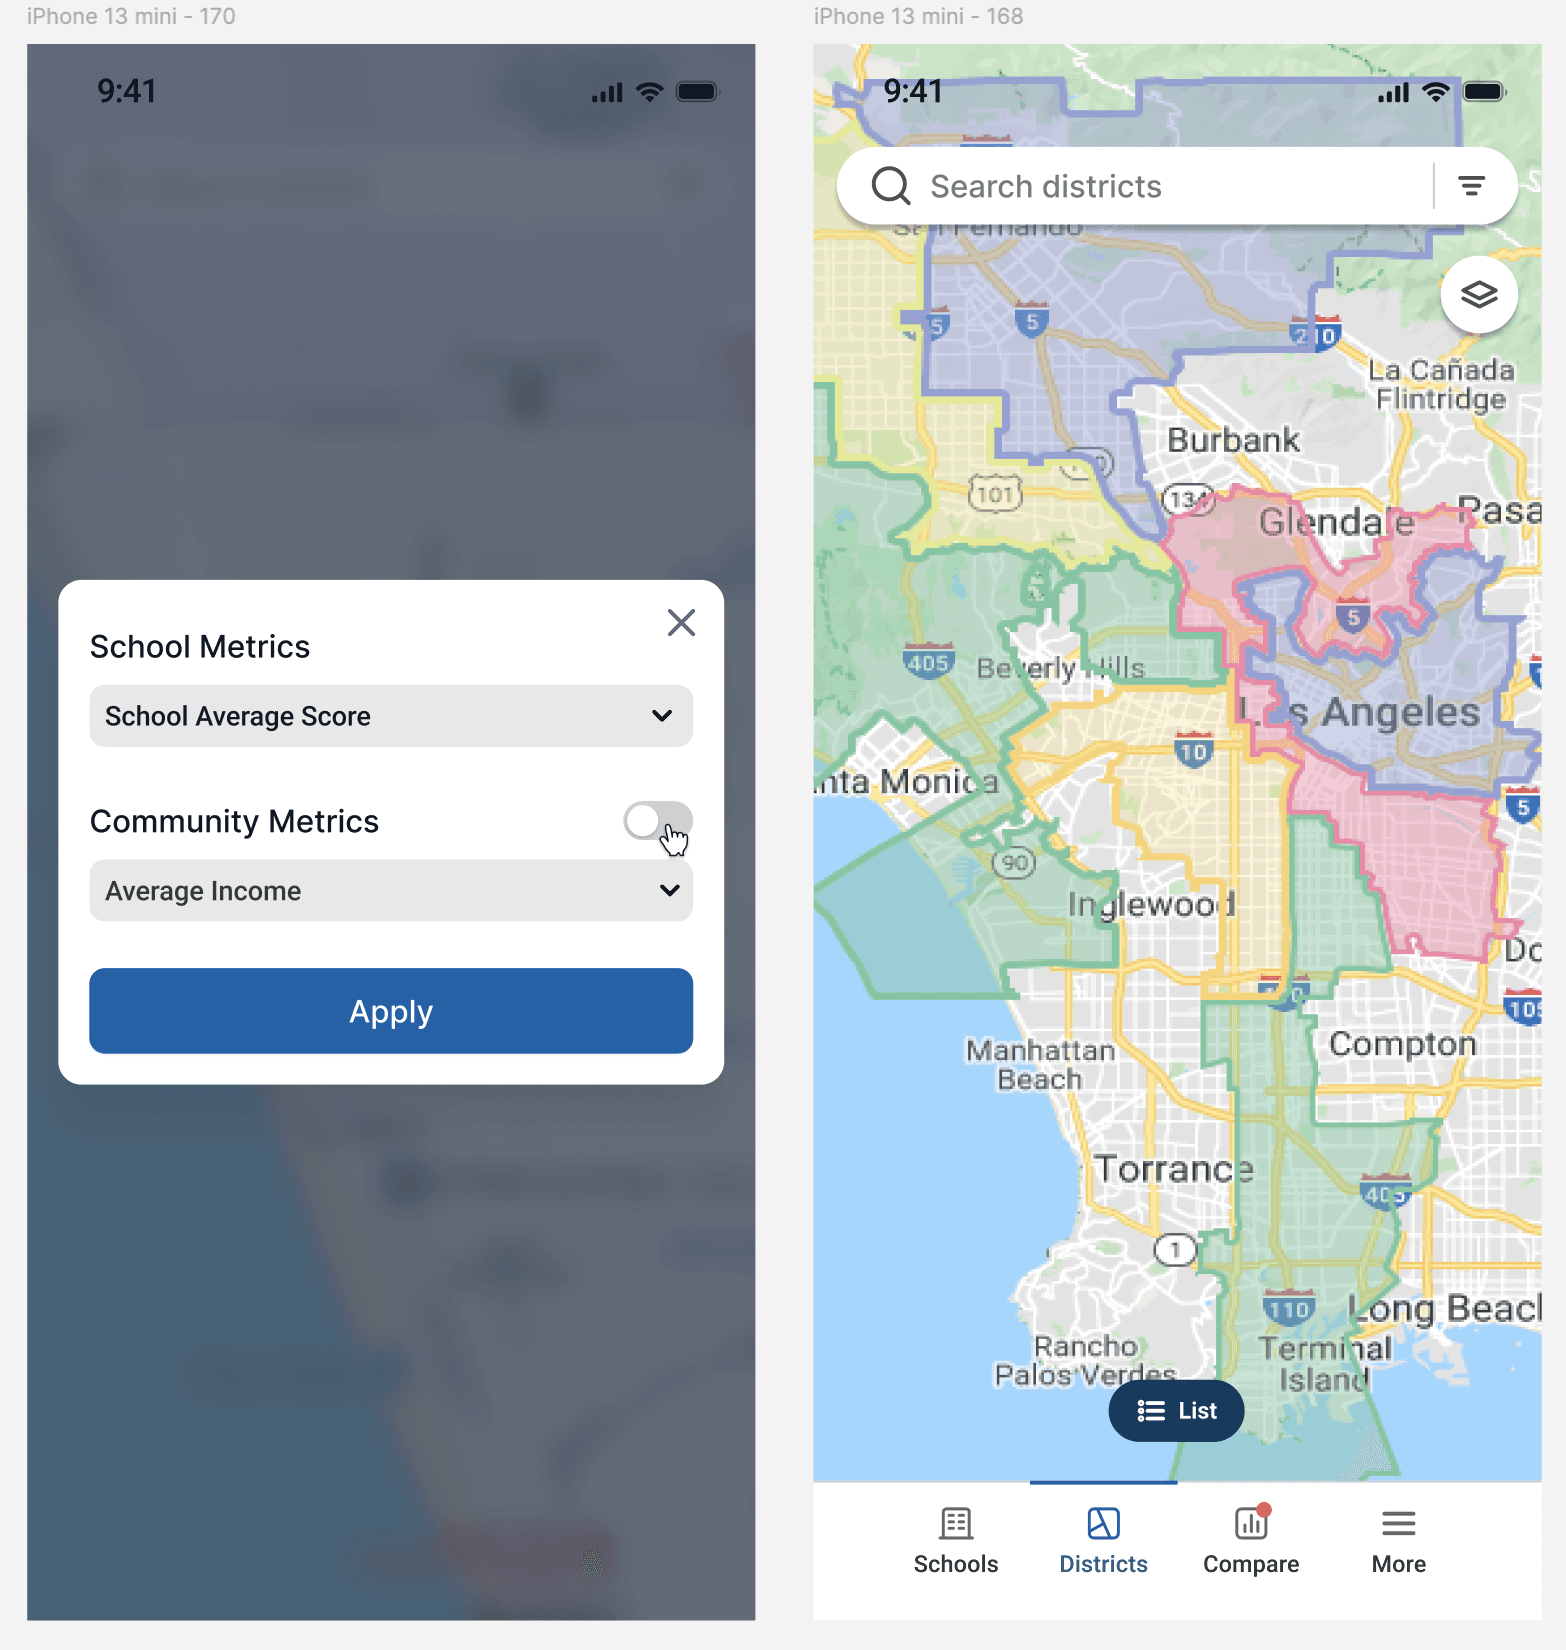
The heatmap feature enables users to choose specific metrics to display on the map, showcasing both school and community data.
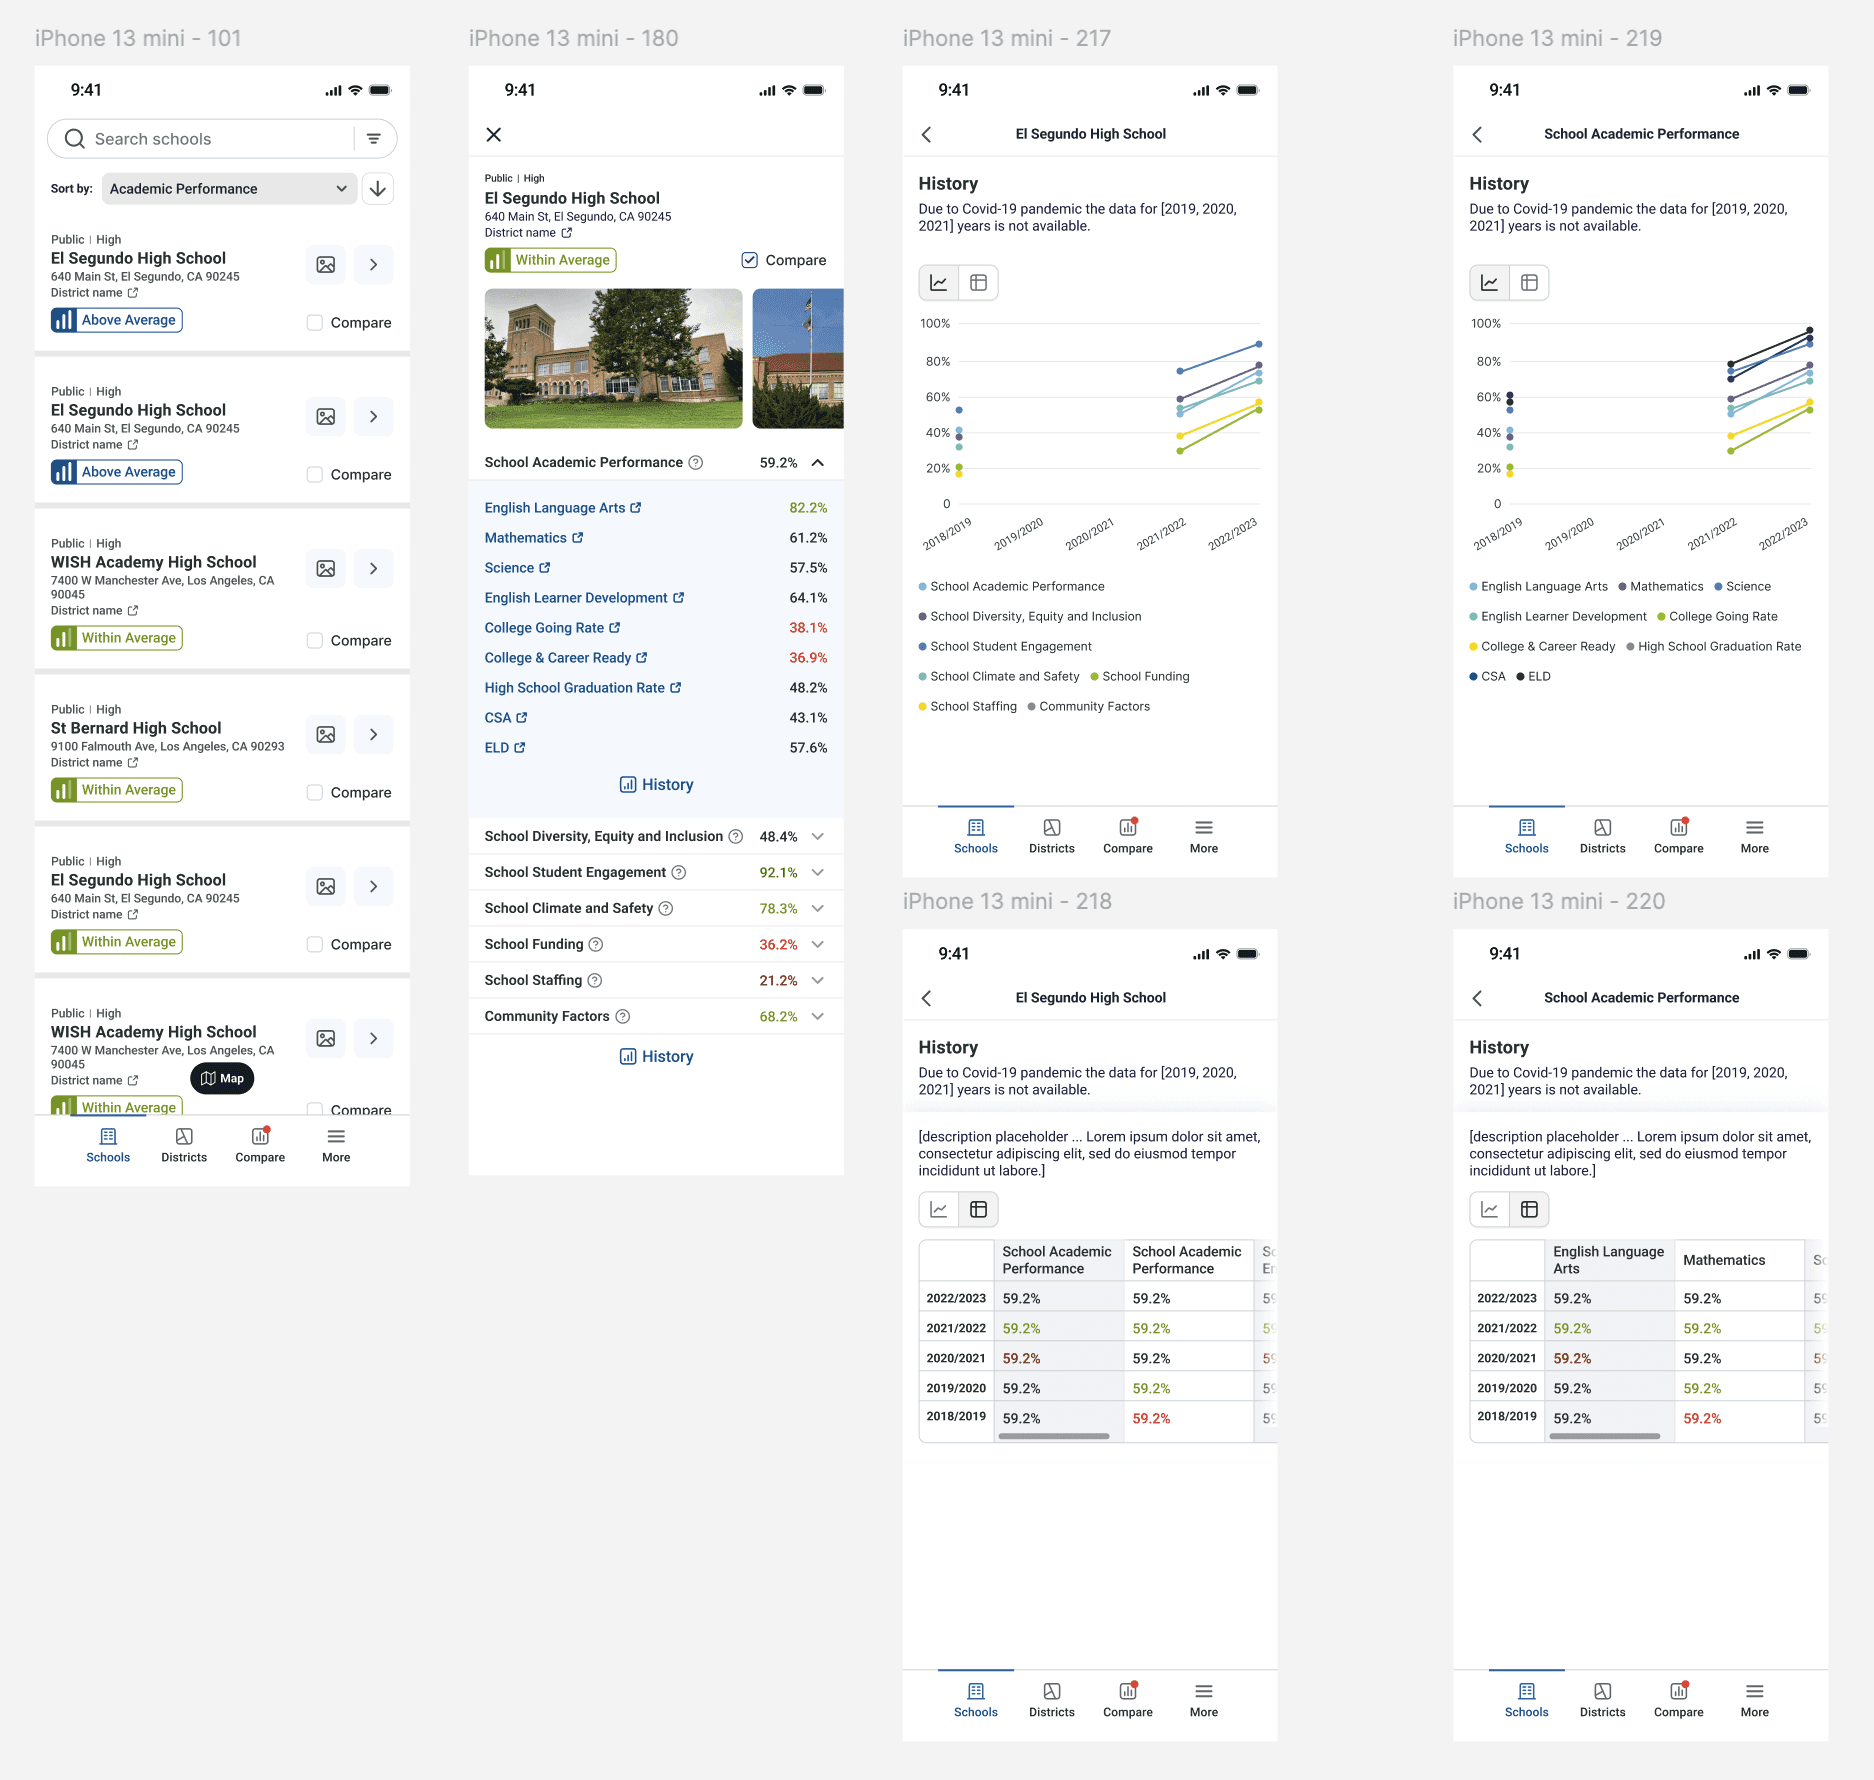
The list view for faster searching and an easier overview of school data.
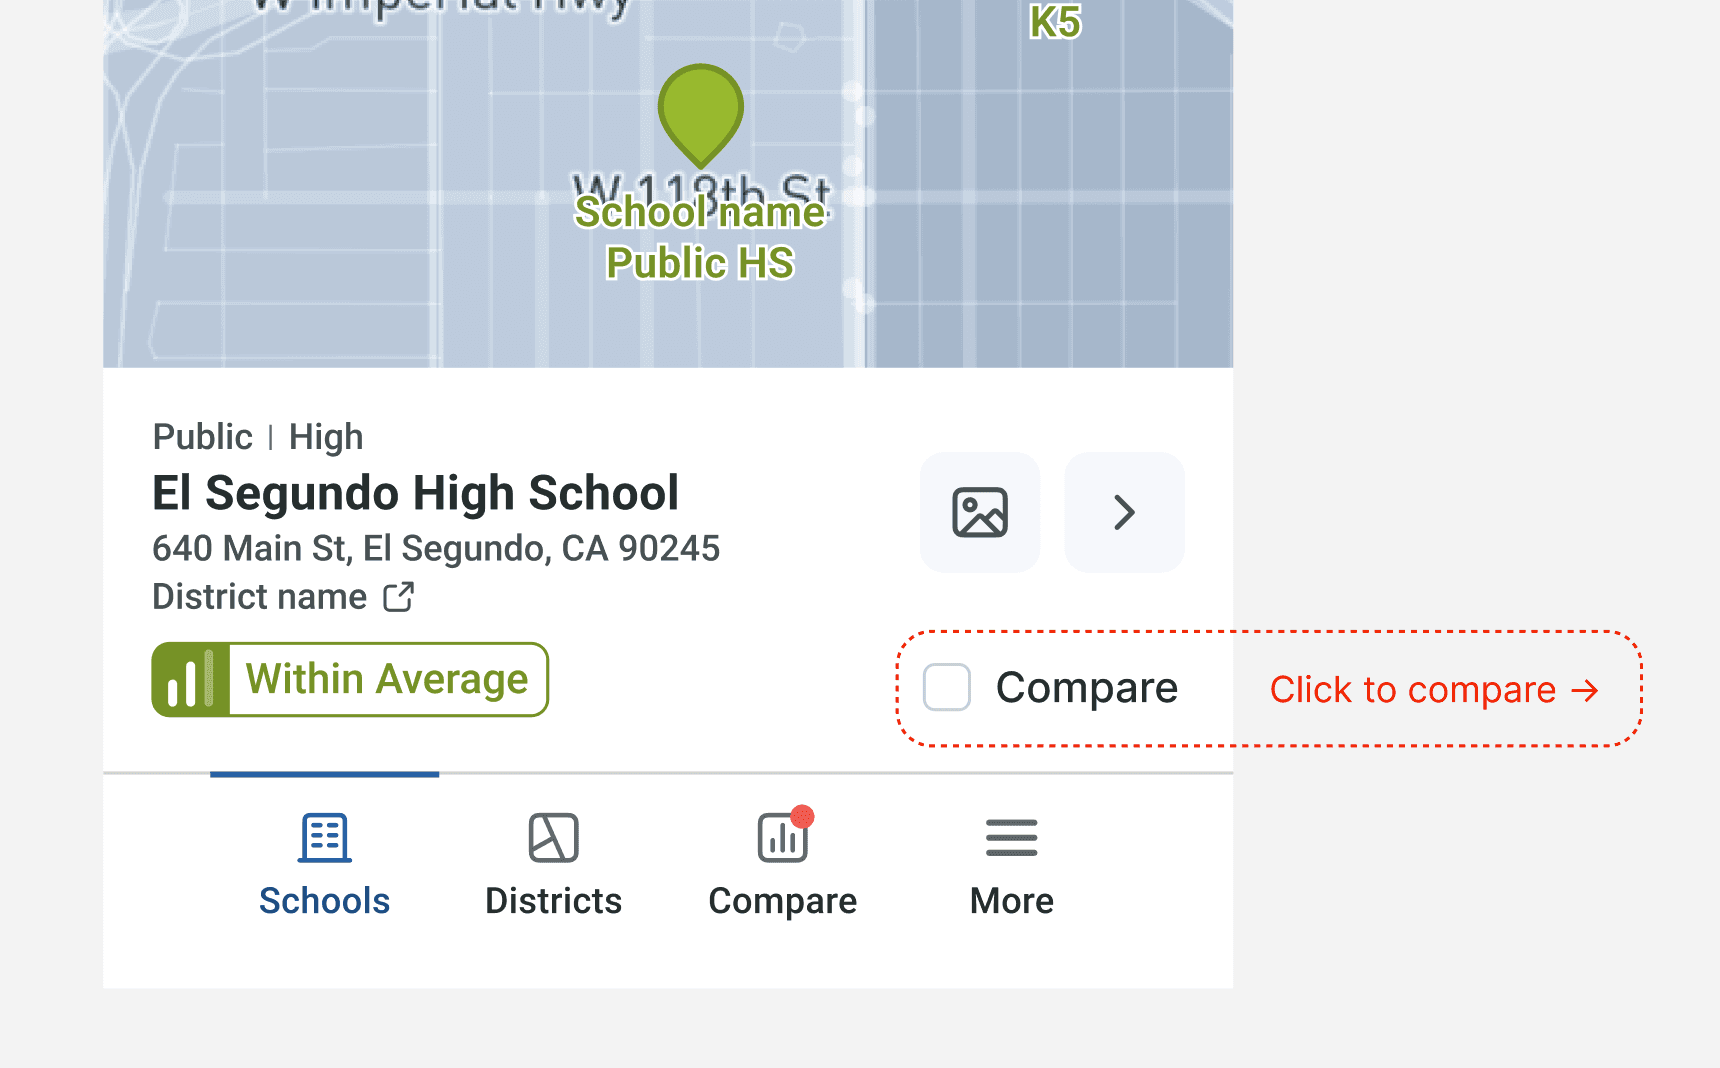
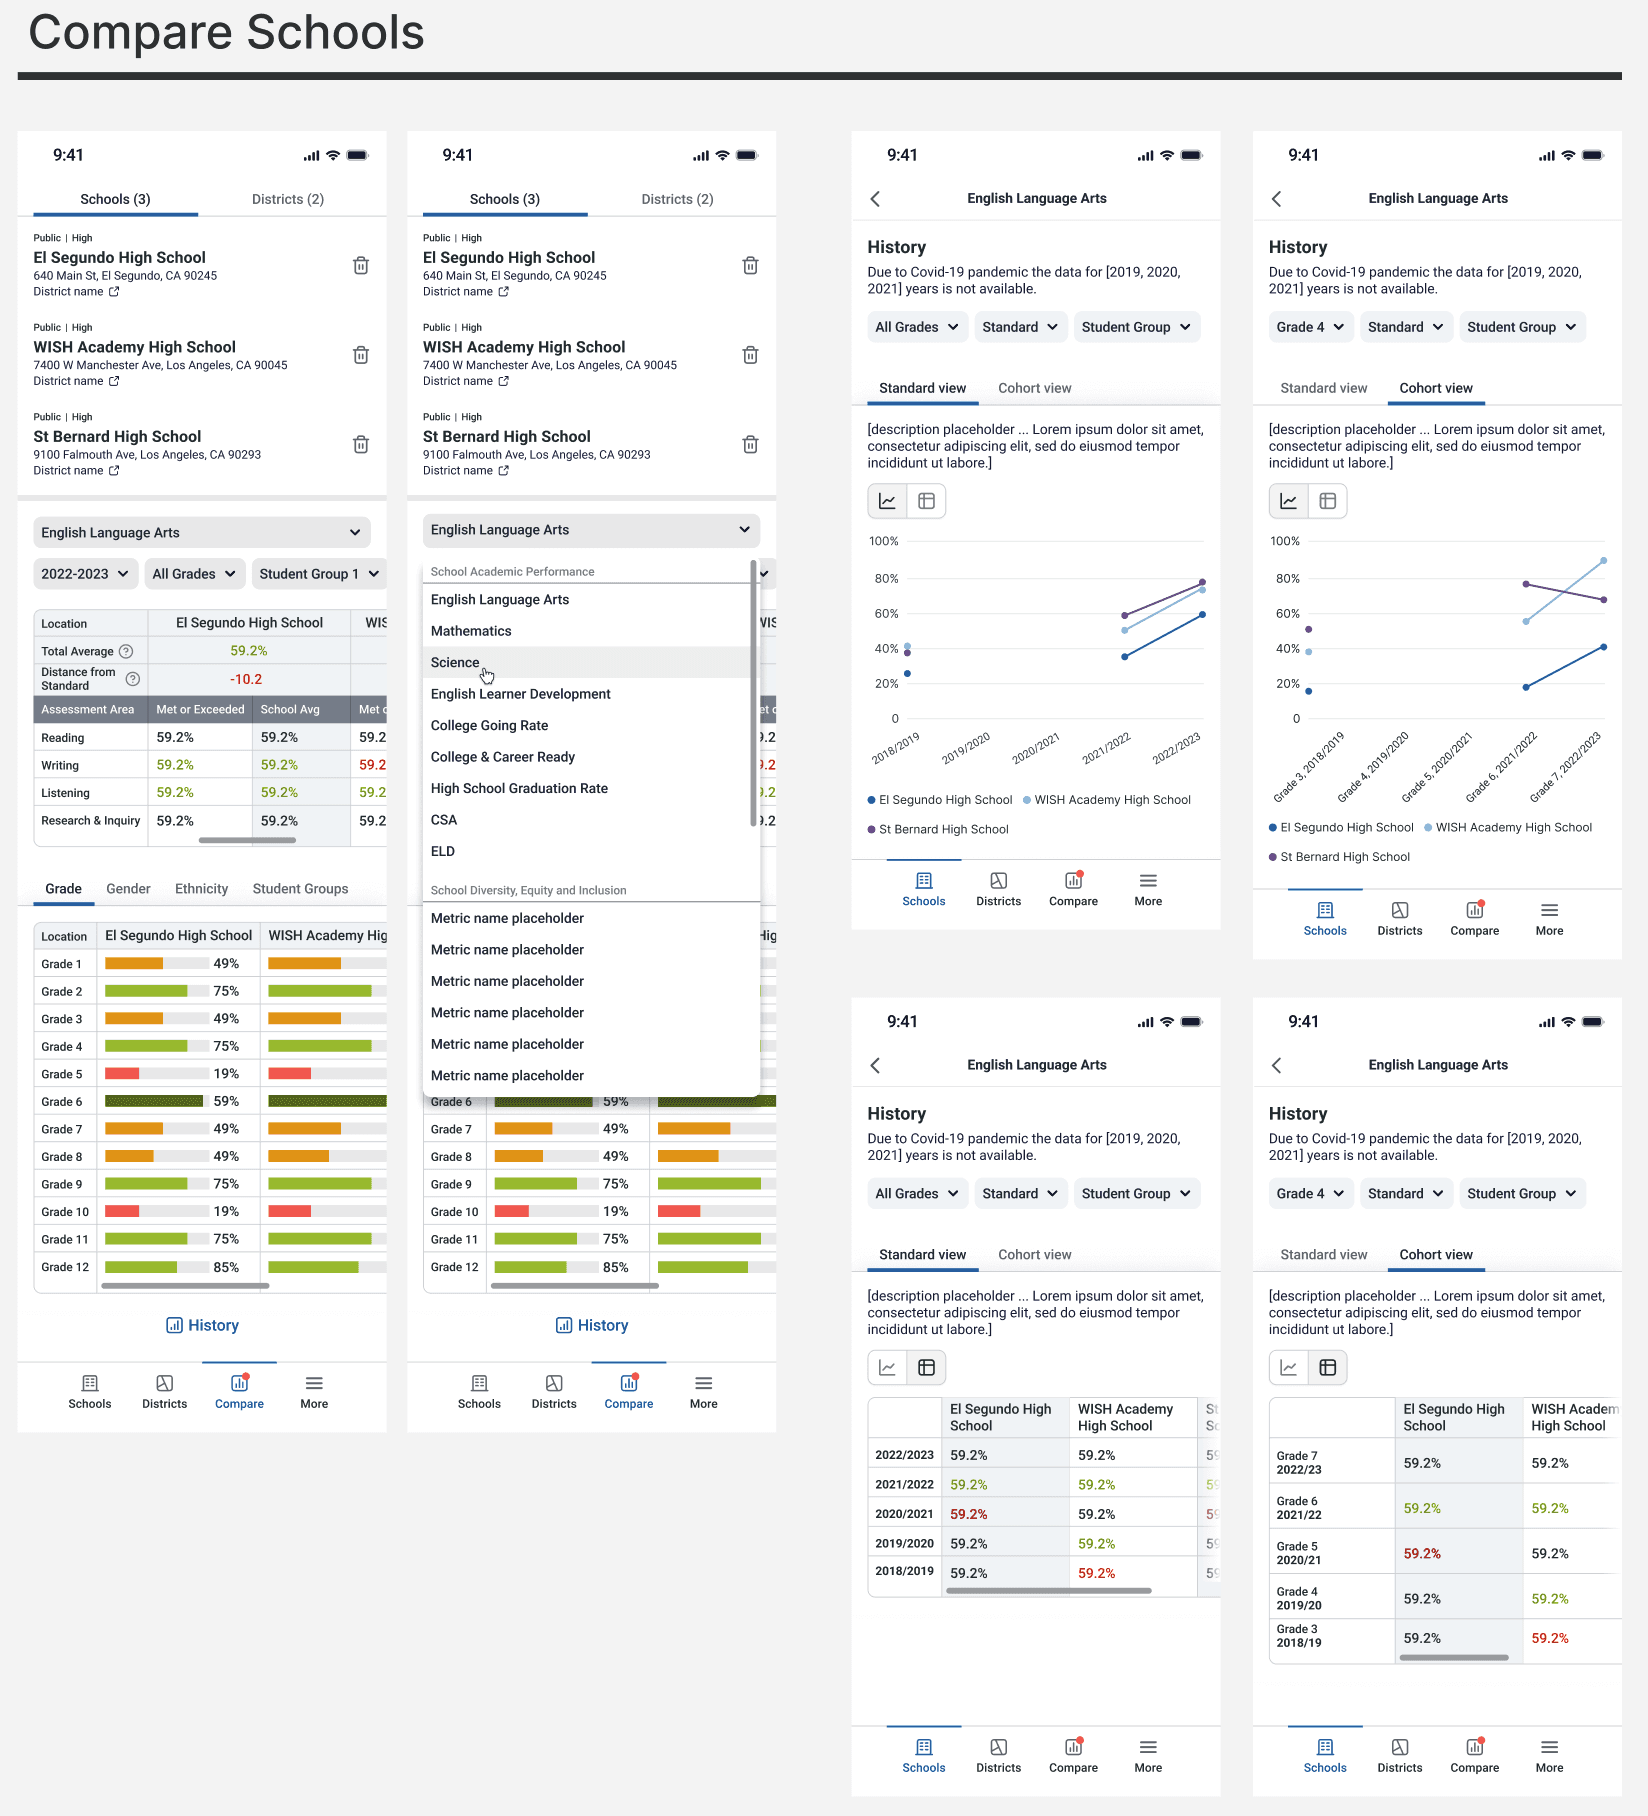
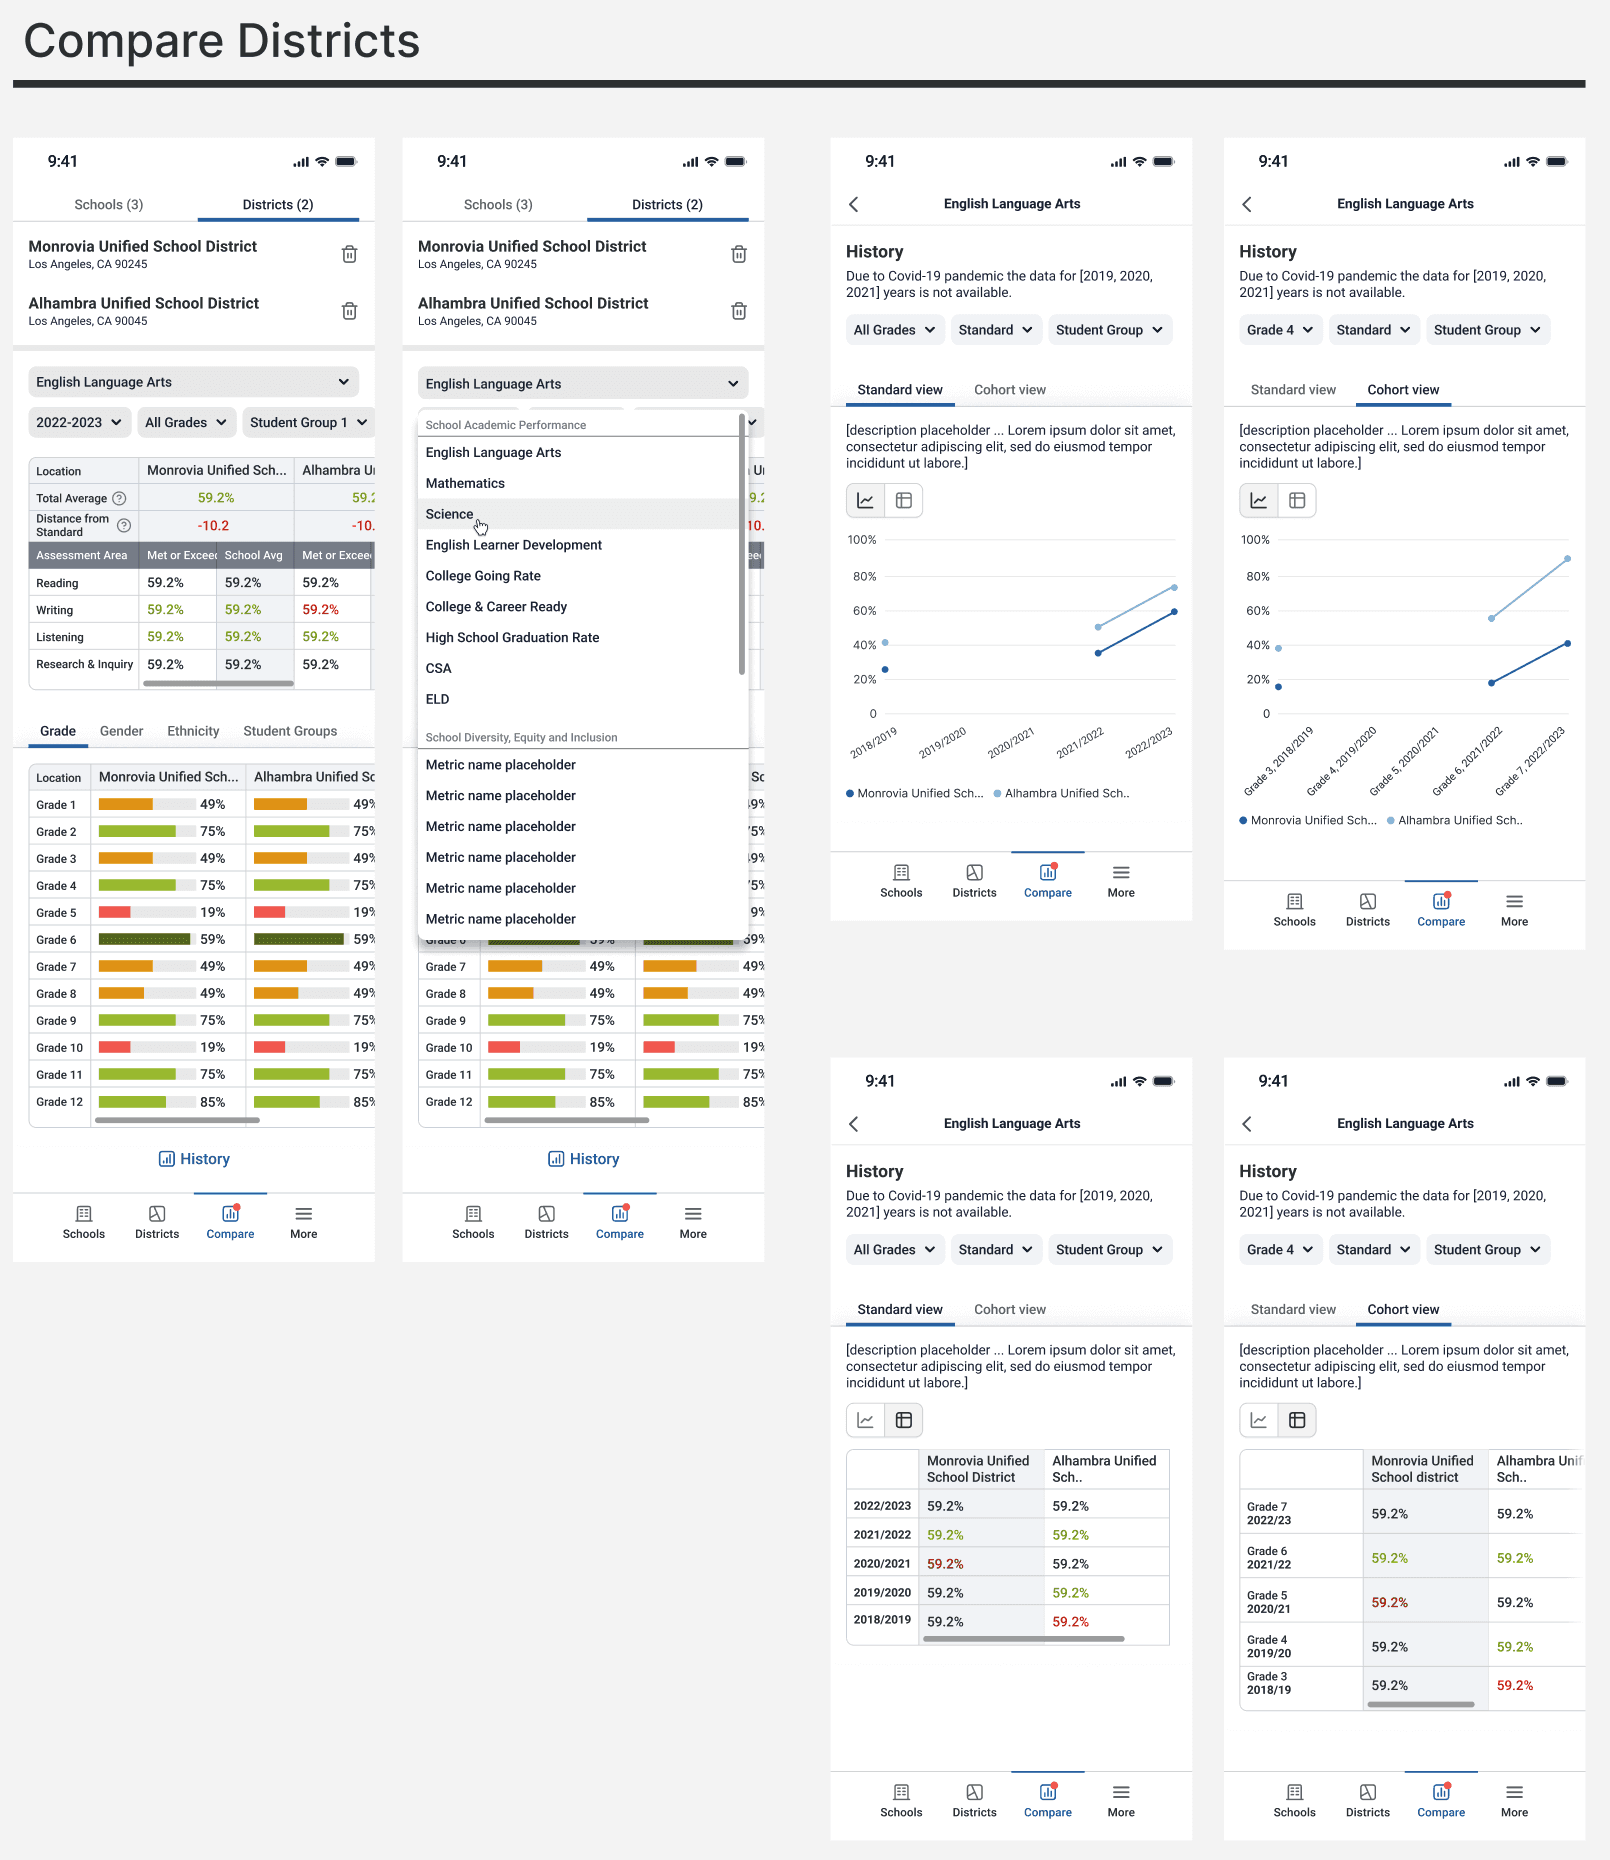
Compare Schools Capability
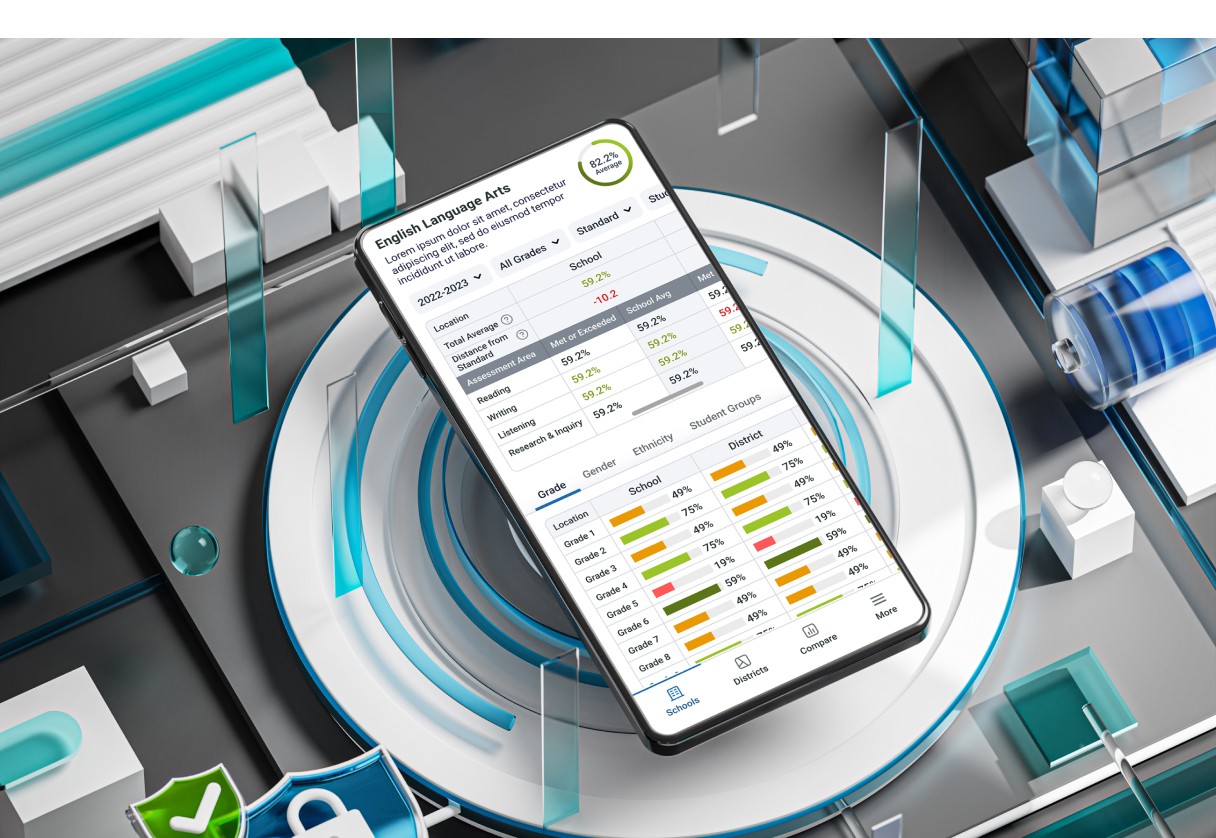
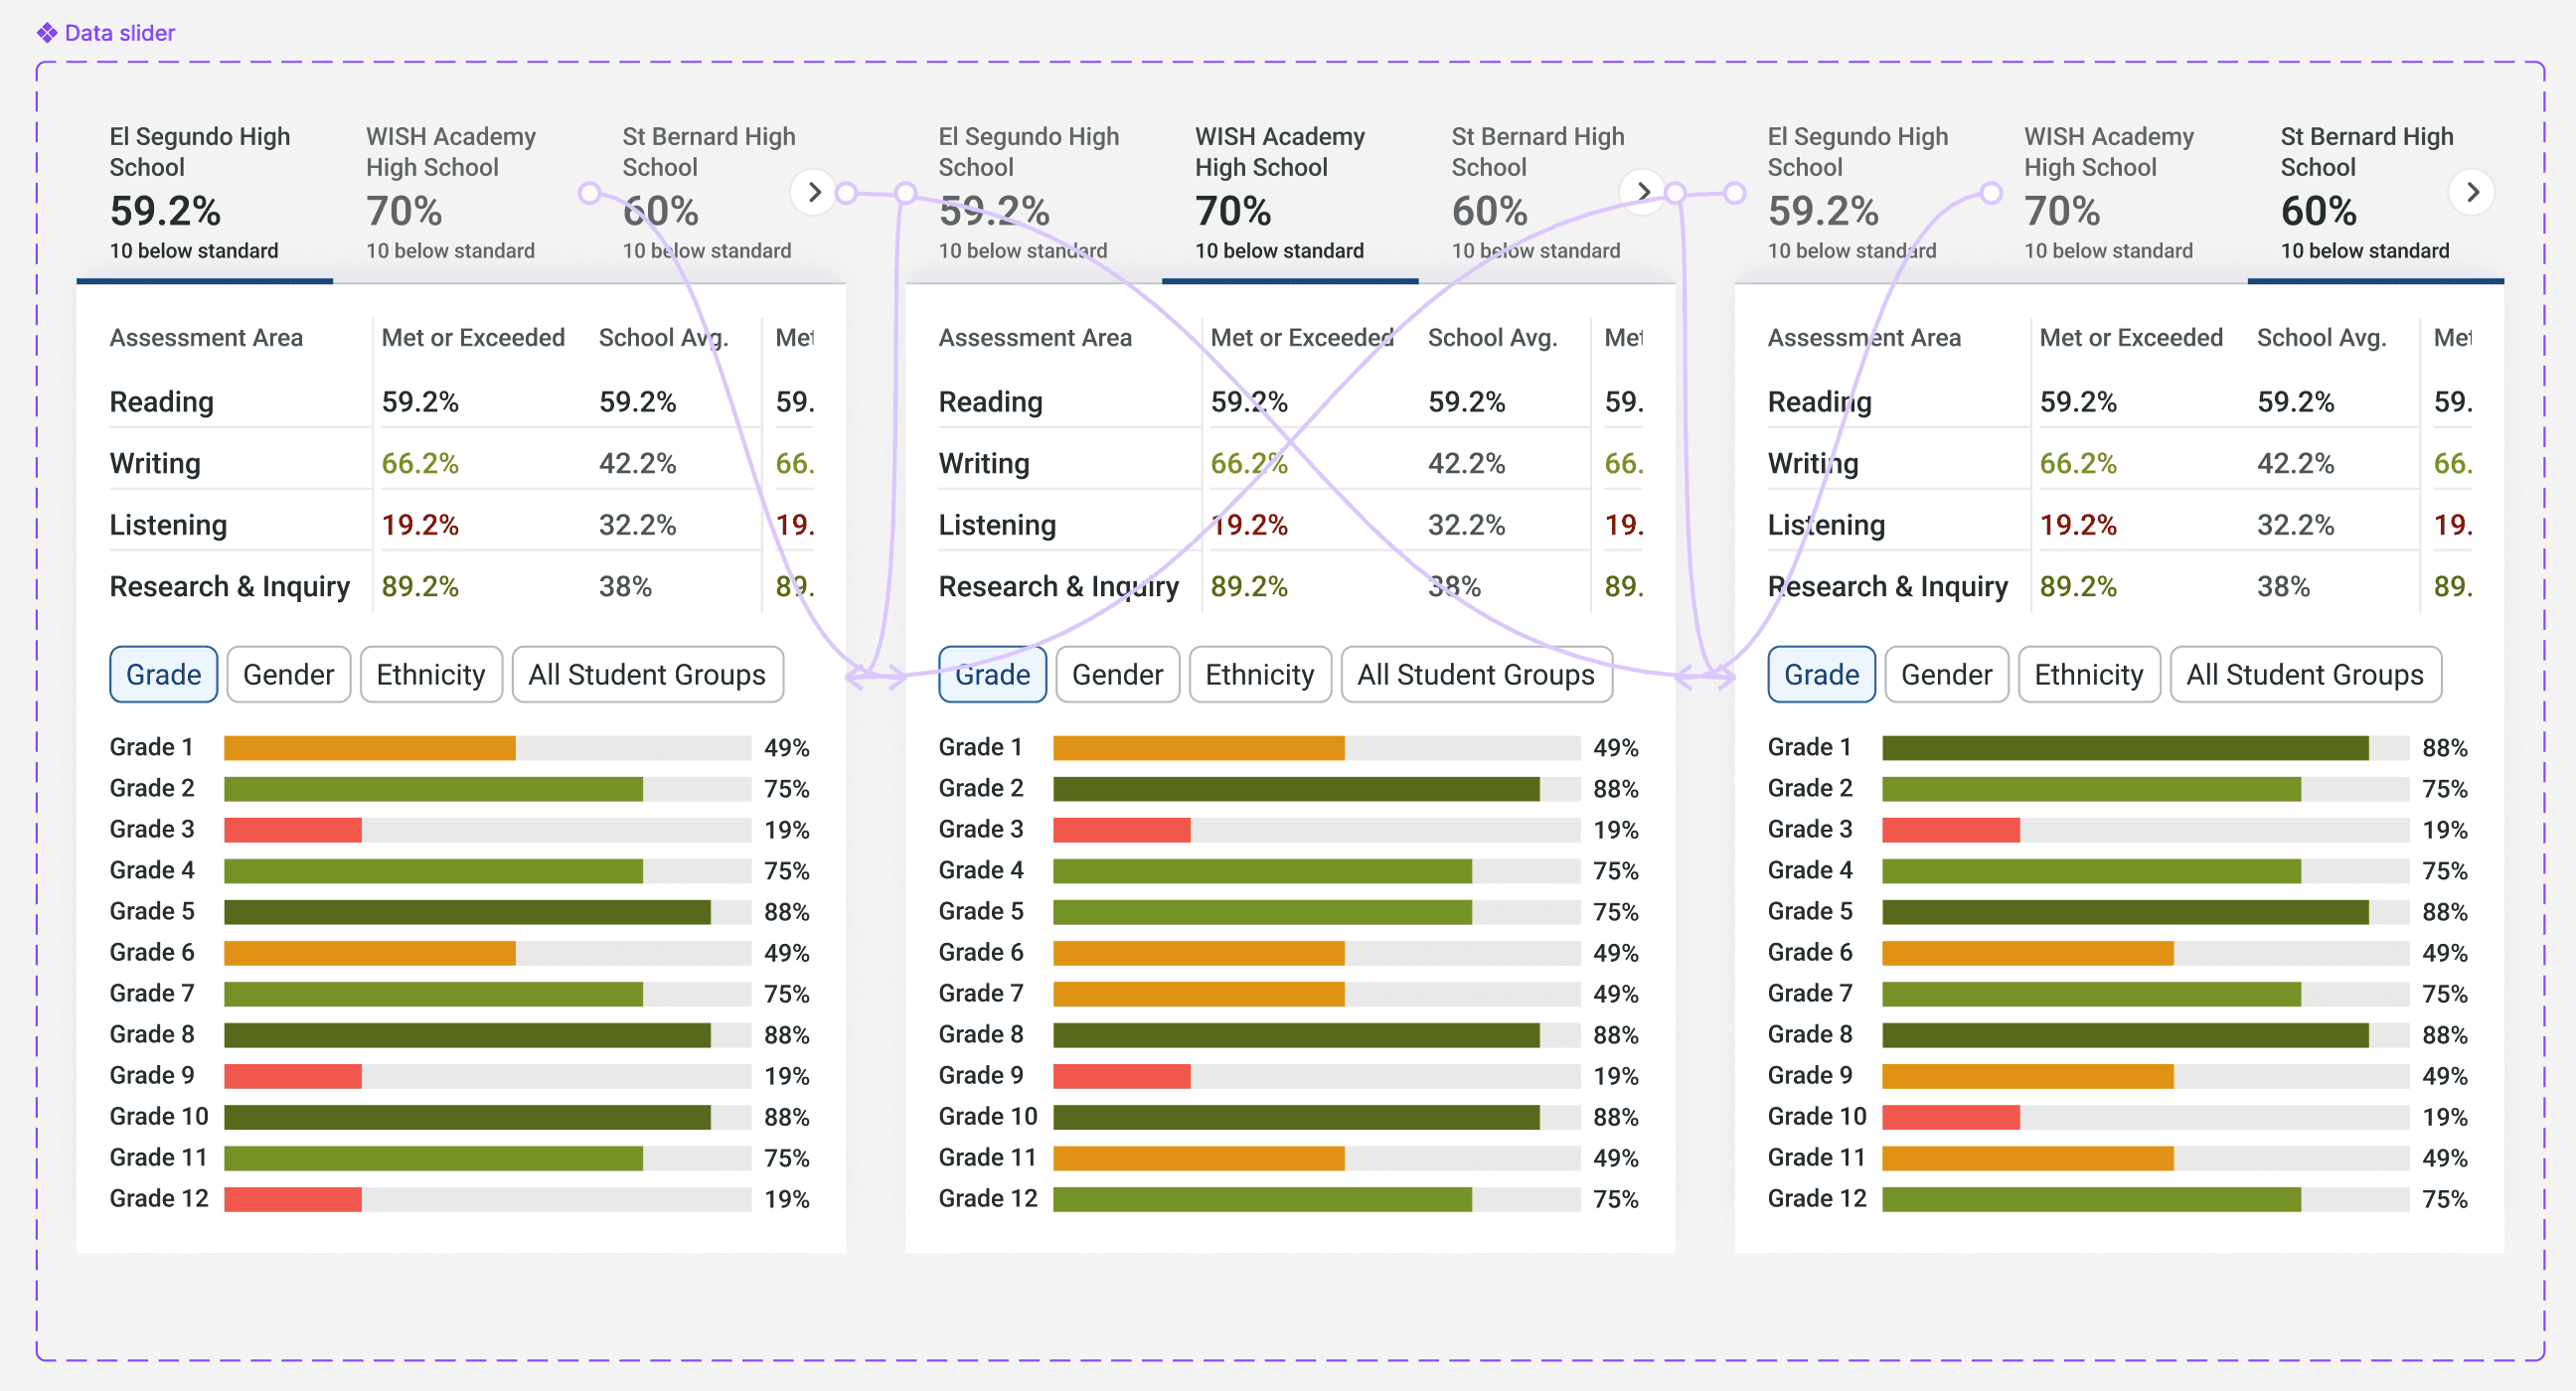
A simple, mobile‑friendly way to compare complex data across multiple schools and districts.
Interactive Prototype
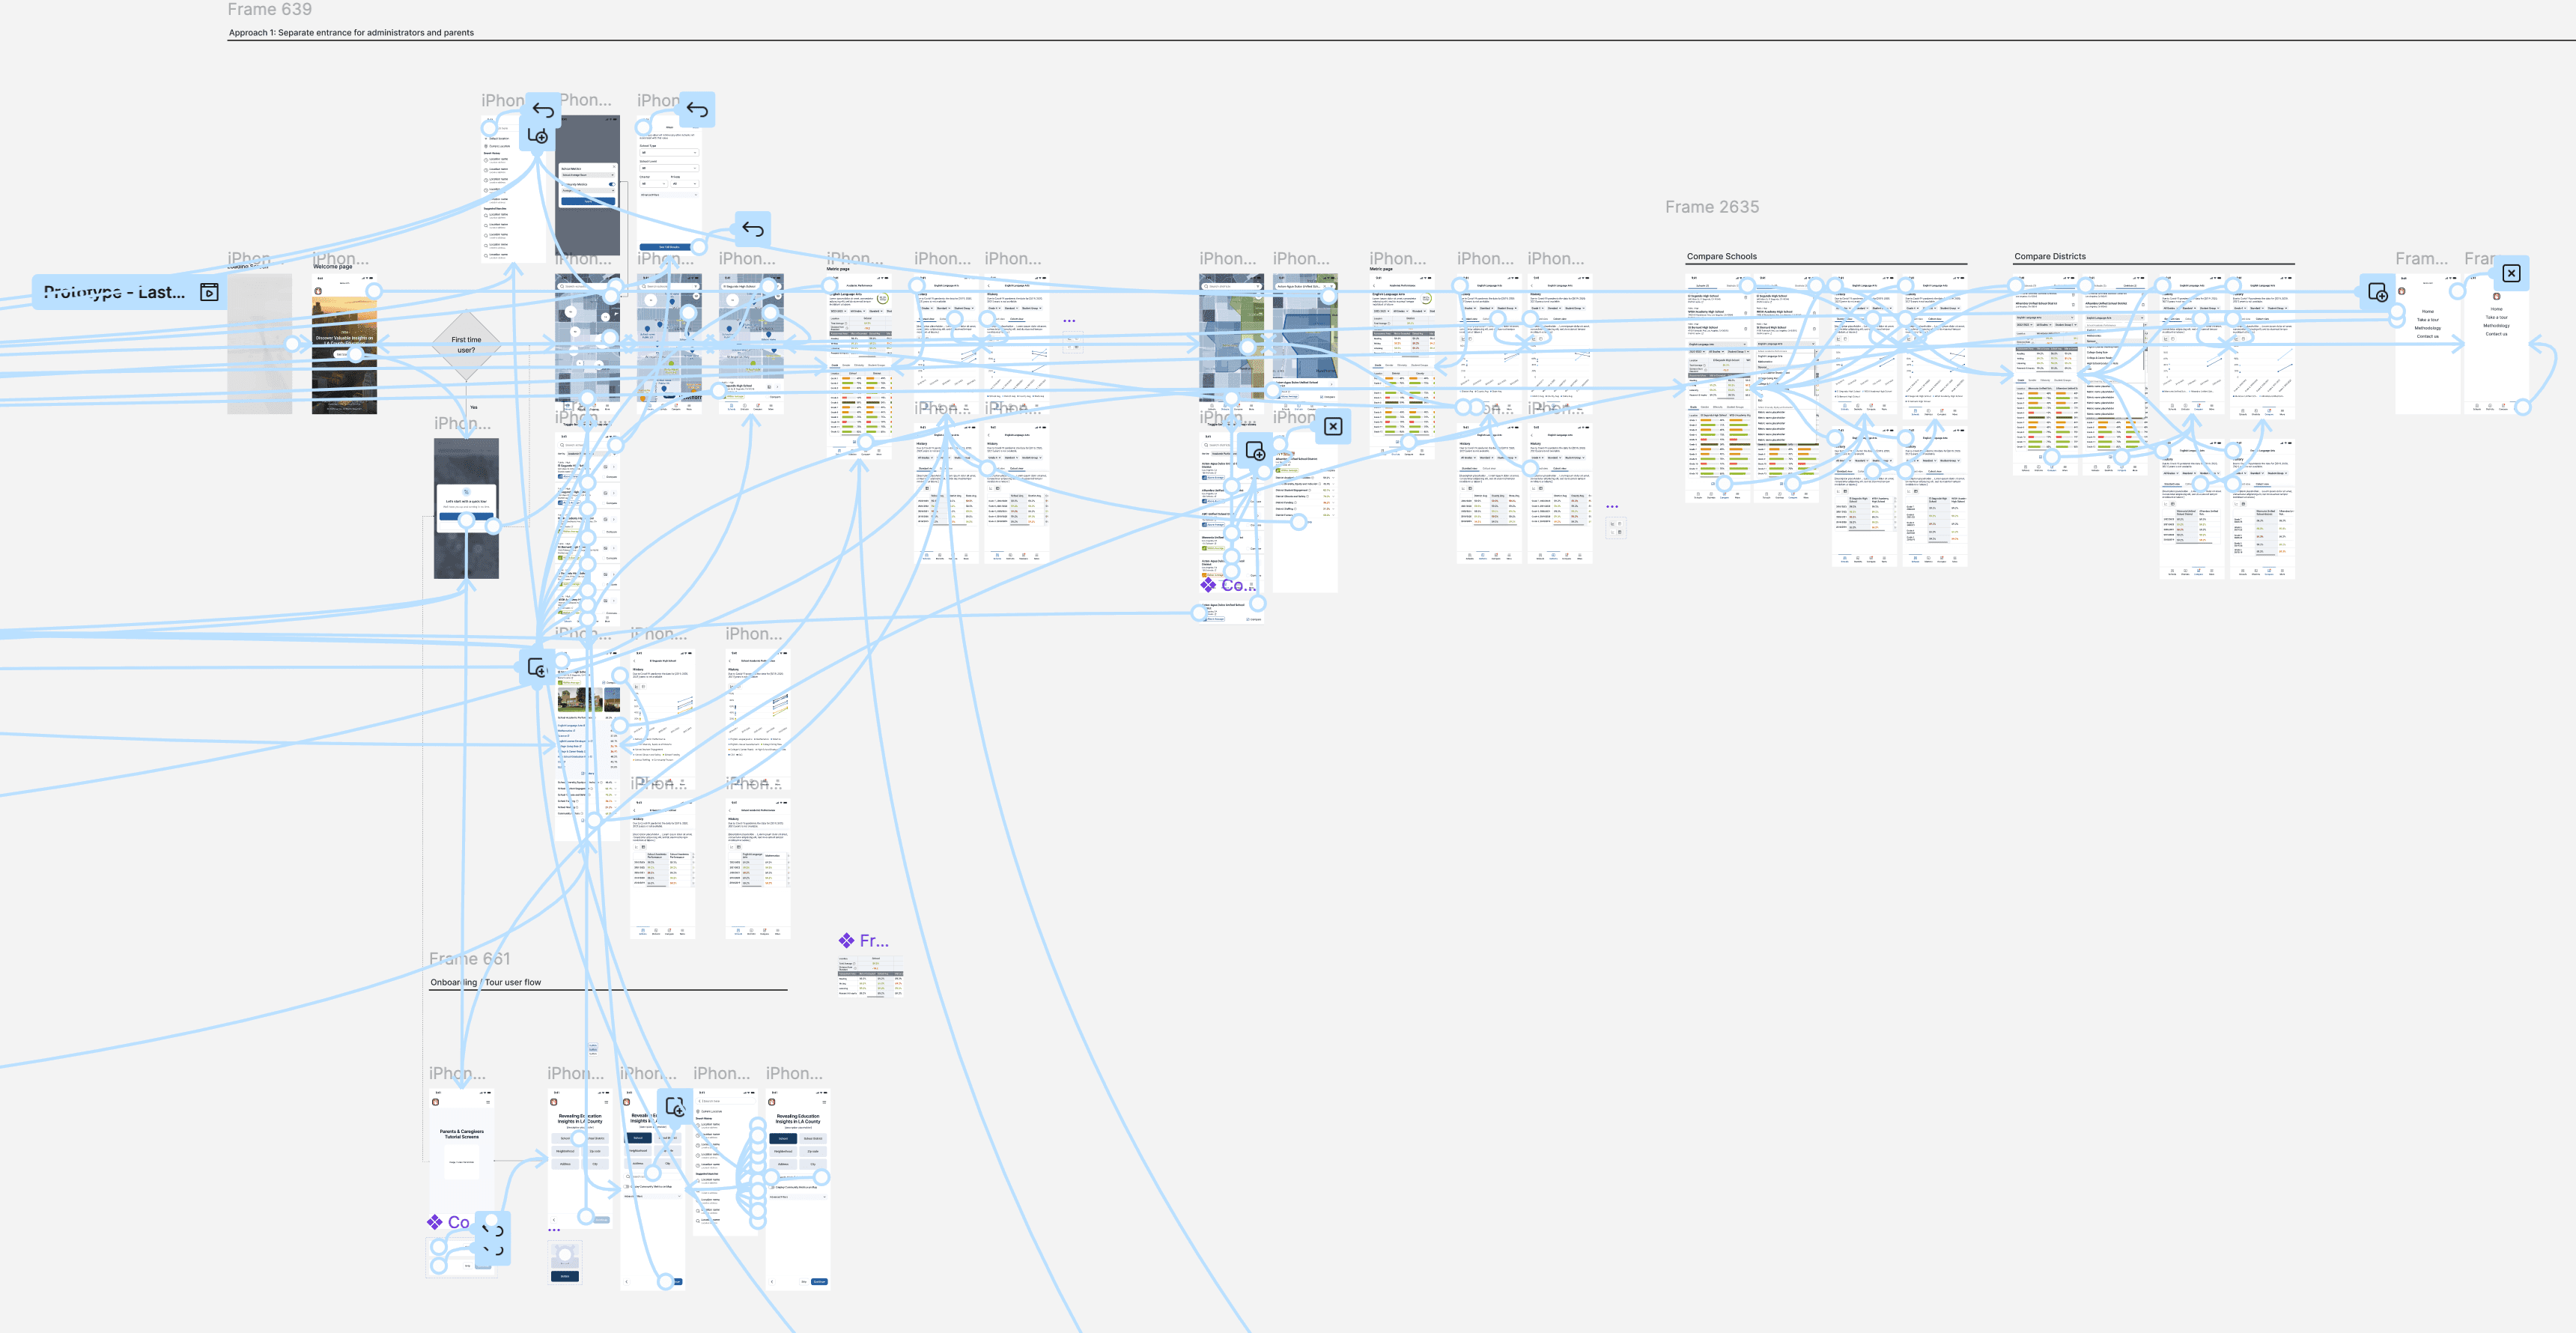
When prototyping, it’s important to create scalable prototypes in Figma and set up basic component‑level interactions before connecting full pages.
Prototype linking
